
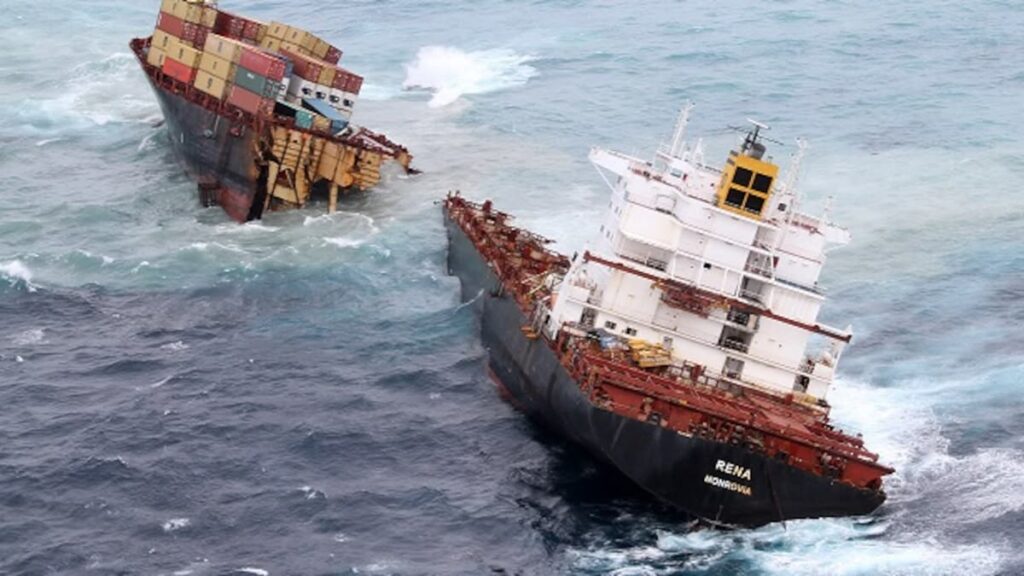
July 3, 2025. The wreck of the container ship Rena, which foundered on Astrolabe Reef off the coast of Tauranga. Photo / Maritime New Zealand
Tauranga’s harbourmaster has taken swift action after learning large ships were using a risky shortcut in the area where the Rena grounding caused New Zealand’s worst maritime environmental disaster.
News the gap between Mōtītī Island and Ōtaiti Astrolabe Reef – which container ship Rena hit in was being used to enter Tauranga Harbour left some locals “mortified” and “shocked”.
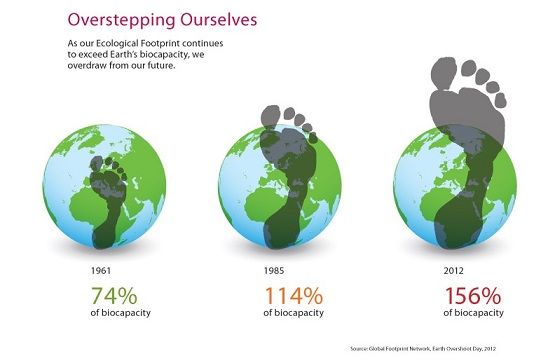
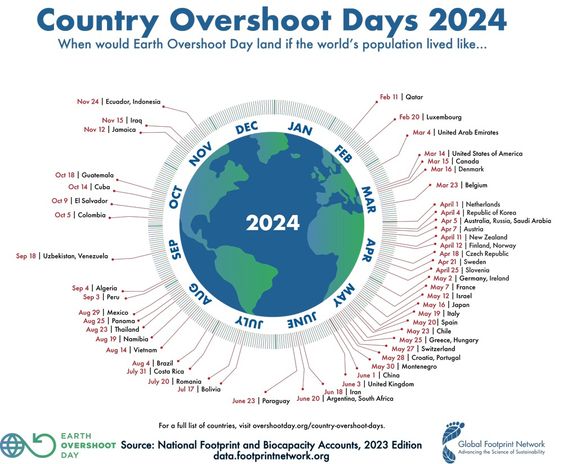
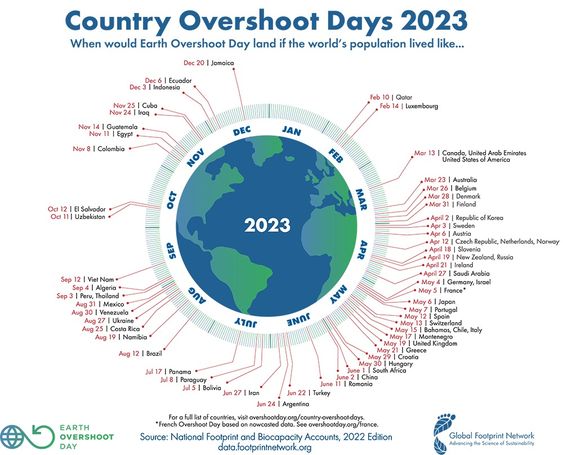
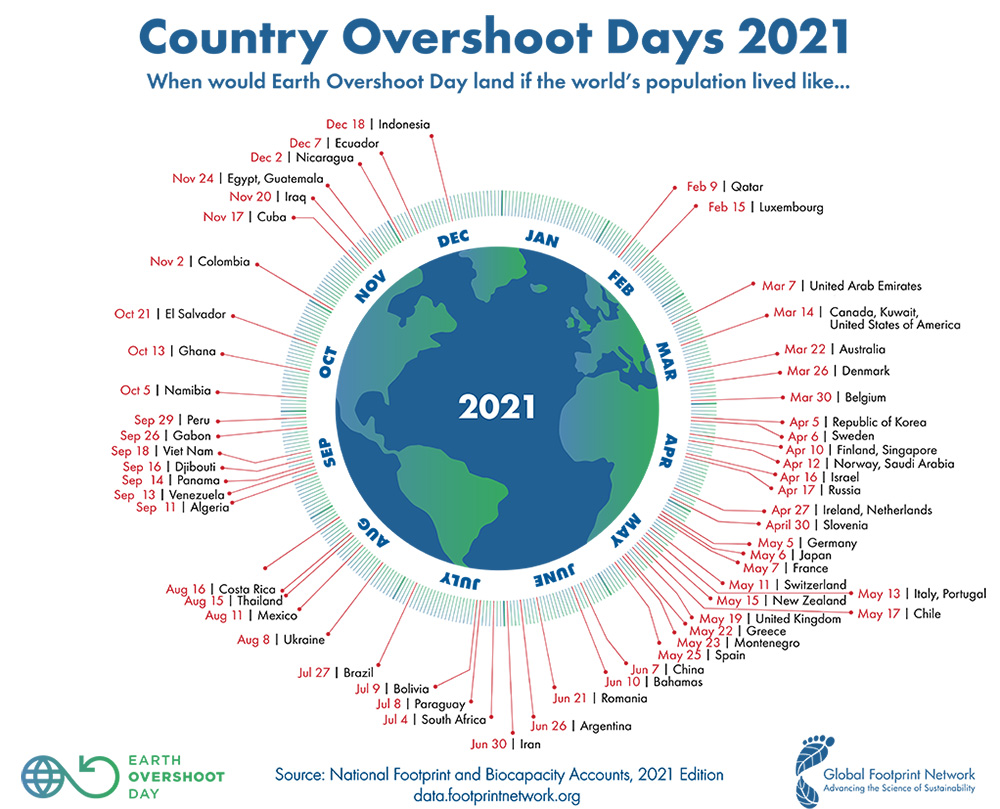
Ecological overshoot occurs when human demand on nature exceeds the Earth’s regenerative capacity, a state that has been in place since the 1970s. It means consuming resources and generating waste faster than ecosystems can replenish or absorb them (e.g., carbon emissions, deforestation). Currently, humanity uses the equivalent of 1.75 Earths.
Updated February 7 and February 10, 2026, first published on Bergensia August 27, 2025.
Our planet has provided us with an abundance of natural resources. But we have not utilized them responsibly and currently consume far beyond what our planet can provide. We must learn how to use and produce in sustainable ways that will reverse the harm that we have inflicted on the planet.
How do we measure circularity?
If we are to create a circular economy, we need to change the framework conditions on several fronts at the same time.

Anders Waage Nilsen
Entrepreneurial activist and storyteller.
Original text first published in Norwegian at The Circle
The idea of a regenerative economy without waste is a utopia. In the same way as a classless society. Or the perfect market. Or the zero-emission society. Such utopias are important because they set ideas in motion. They are endstations in various stories about the path to a better society. They can give direction and legitimacy to politics and strategy.
At the same time, they can be dangerous. The distance between the present situation and the utopia is often large. It can create powerlessness and frustration. There is no “revolution” that can instantly change heavy industrial and economic structures. Often the stories become too simple. The road to a more circular society requires systematic work, on many fronts, over a long period of time. Whether you are a state or a company, a form of systematics is required, a structure of counting edges that tells us that we are on the right course.
This system is lacking today. Partly because the circular economy is poorly understood. Partly because circularity is a rather abstract, weakly defined, and systemic concept that is interpreted and understood differently. Lately, I’ve been thinking a lot about these drivers behind the circular economy. What are the underlying goals that point in the direction of circularity, what are the associated goal numbers?
What needs to be changed must be measured. To create politics or strategy for something, we need something that tells us that we are on the right path. We must put labels on the improvements we want to create, identify instruments, and who is responsible. At the same time, in any circular model, there will be many dependencies: for example, it is impossible to build profitable recycling without things being collected. It is impossible to scale collection without there being a demand for secondary raw materials. And so on. It quickly becomes so systemic that one becomes dizzy.
Is it possible to simplify? I tried to make a model where I define some external conditions that indirectly contribute to the phenomenon that is often referred to as circularity. I thought of it all as a kind of algorithm: To increase the circularity, one must create a change for the better in one or more underlying target numbers. Such a framework of well-defined indicators may perhaps lead us in the direction of a circular economy, which I think of as an emergent state. Slightly inspired by the OKR model of Google (“objectives and key results”), I drew up this model;
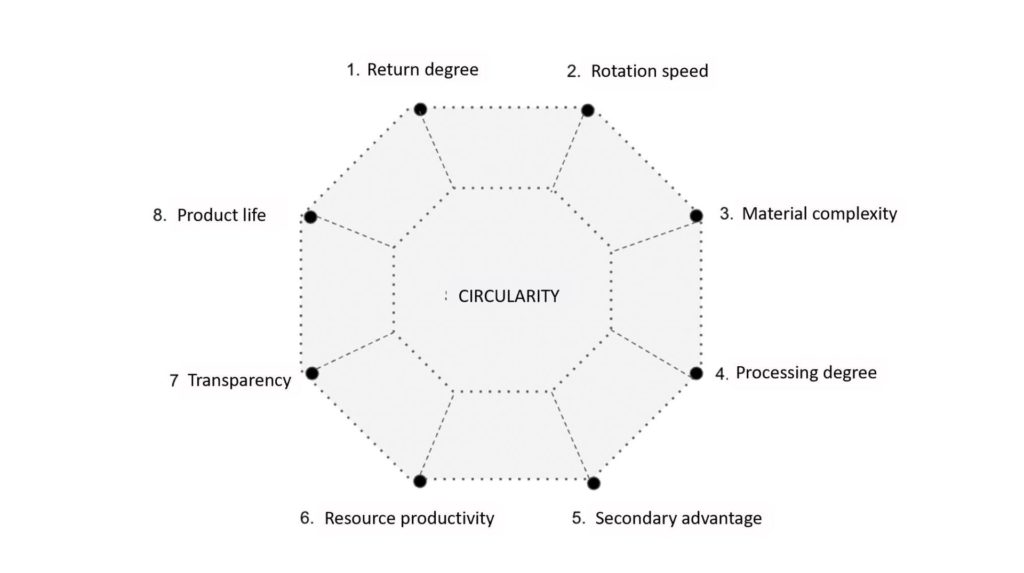
The numbered points are concrete indicators that 1) can be improved and 2) are measurable. Circularity is at the center of the model, a kind of high-level target figure. I think this is the degree of value creation in society that is based on repurposing, reusing, and recycling resources. That is the part of the economy that is not driven by virgin input factors. Behind each point, there is a definition and a set of underlying sub-goals and target numbers.
1. Return degree
The degree of return is about the proportion of our materials that are returned to the system to be included in existing or potential circular value chains. That is, how much of the materials do not go to landfills or incineration. It is thus about a good system for waste management, with a sorting infrastructure that supports the processes further back in the value chain. The deposit scheme for plastic bottles/and aluminum cans is a good example of a tool that has increased the return rate.
2. Rotation speed
Very many molecules are long unproductive, in landfills, warehouses, and outdoor stalls. Rotation speed is about how efficiently we manage to get them back into production. This is especially important for resources that are in short supply, such as precious metals. Here we can work on creating incentive systems and return programs that make it more profitable to deliver something back than to have it lying around. The cell phone mortgage is a good example.
3. Material complexity
As long as our products are designed in a way that makes them non-recyclable, most will go to lower-grade recycling. Material complexity is about the proportion of material that can be returned to the loop with the same (or better) quality. The goal is thus the lowest possible complexity, the highest possible purity. Plastic packaging composed of several types of plastic or non-recyclable composites increases complexity.
4. Processing degree
This is about how high we manage to lift our material resources in the value pyramid. What you collect can be treated in different ways. Very much of what is called “recycling” in the statistics is in down circulation. There is great potential for reusing the materials at the same level or even increasing the value through refining – upscale-recycling.
5. Secondary advantage
Secondary advantage is a new word, it describes how competitive reused/recycled material is, compared to virgin / new materials. If virgin material is cheaper than recycled material, the secondary advantage is negative. It is not profitable to use such materials, ergo the demand is low. Here we are talking about a combination of regulatory conditions (for example, taxation of virgin material) and reduced costs in the production stage.
6. Resource productivity
Resource productivity in this context is about how much value we create per unit or energy unit. Here both improvement and innovation come into the picture, this is about both product design, the production process, and business models. Can we reduce the amount of materials used? Can we build new service models that allow more consumers to share products? Can we change attitudes among consumers that reduce or eliminate demand altogether?
7. Transparency
Transparency is about our ability to calculate the footprint of a product or service throughout the value chain. So we are talking here about the data basis for life cycle calculations. This target number takes into account that an end product will always be the sum of a bunch of underlying processes. High transparency means that the footprint can be visible to consumers. If you want to strengthen transparency, both documentation requirements and value chain initiatives can be important tools.
8. Product life
Product life says something about how long the manufactured product has value before it has to return to the loop. In many product categories, both electronics, means of transport, and construction, it will be important to extend the service life. A commercial building, for example, has an average lifespan of 58 years, if we manage to double the lifespan (either on the building itself or the materials used), we will in practice halve the CO2 footprint. This is where maintenance, repair, and design come into play. A relevant tool could be Right to repair, which was introduced in France in 2020.
Anders
Does this model work?
I do not know. This is a thought experiment, which is still in its early stages. I am a practical solution architect, not a social economist. For my part, I personally experience that the map functions as a functional thinking tool to unravel the intricacies of circularity and find points for improvement. But maybe there are some others who have suggestions on how the model can be improved?
Website Planet: Fast Fashion’s Environmental Impact

United Nations Global Goals for Sustainable Development
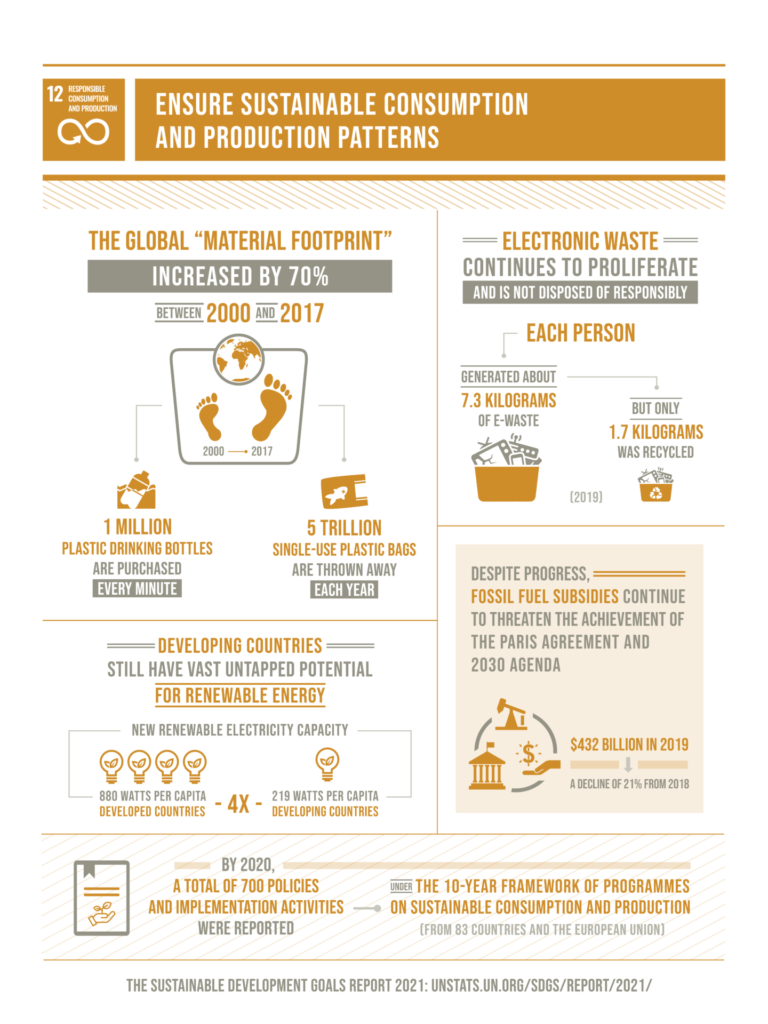
Goal 12: Ensure sustainable consumption and production patterns
Worldwide consumption and production — a driving force of the global economy — rest on the use of the natural environment and resources in a way that continues to have destructive impacts on the planet.
Economic and social progress over the last century has been accompanied by environmental degradation that is endangering the very systems on which our future development — indeed, our very survival — depends.
A few facts and figures:
- Each year, an estimated one third of all food produced – equivalent to 1.3 billion tonnes worth around $1 trillion – ends up rotting in the bins of consumers and retailers, or spoiling due to poor transportation and harvesting practices.
- If people worldwide switched to energy efficient light bulbs the world would save US$120 billion annually.
- Should the global population reach 9.6 billion by 2050, the equivalent of almost three planets could be required to provide the natural resources needed to sustain current lifestyles.
The COVID-19 pandemic offers countries an opportunity to build recovery plans that will reverse current trends and change our consumption and production patterns towards a more sustainable future.
Sustainable consumption and production are about doing more and better with less. It is also about decoupling economic growth from environmental degradation, increasing resource efficiency, and promoting sustainable lifestyles.
Sustainable consumption and production can also contribute substantially to poverty alleviation and the transition towards low-carbon and green economies.
COVID-19 response
The current crisis is an opportunity for a profound, systemic shift to a more sustainable economy that works for both people and the planet.
The emergence of COVID-19 has underscored the relationship between people and nature and revealed the fundamental tenets of the trade-off we consistently face: humans have unlimited needs, but the planet has a limited capacity to satisfy them. We must try to understand and appreciate the limits to which humans can push nature before the impact is negative. Those limits must be reflected in our consumption and production patterns.
COVID-19 can be a catalyst for social change. We must build back better and transition our production and consumption patterns towards more sustainable practices.
Facts and Figures
- According to latest projections, the global population could grow to around 8.5 billion in 2030, 9.7 billion in 2050. The equivalent of almost three planets could be required to provide the natural resources needed to sustain current lifestyles.
- 93 percent of the world’s 250 largest companies are now reporting on sustainability.
Water
- Less than 3 percent of the world’s water is fresh (drinkable), of which 2.5 percent is frozen in the Antarctica, Arctic and glaciers. Humanity must therefore rely on 0.5 percent for all of man’s ecosystem’s and freshwater needs.
- Humankind is polluting water in rivers and lakes faster than nature can recycle and purify
- More than 1 billion people still do not have access to fresh water.
- Excessive use of water contributes to the global water stress.
- Water is free from nature, but the infrastructure needed to deliver it is expensive.
- Water use has been increasing worldwide by about 1 percent per year since the 1980s.
- Agriculture (including irrigation, livestock and aquaculture) is by far the largest water consumer, accounting for 69 percent of annual water withdrawals globally. Industry (including power generation) accounts for 19 percent and households for 12 percent.
- Over 2 billion people live in countries experiencing high water stress.
- Over the period 1995–2015, floods accounted for 43 percent of all documented natural disasters, affecting 2.3 billion people, killing 157,000 more and causing US$662 billion in damage.
- Three out of ten people (2.1 billion people, or 29 percent of the global population) did not use a safely managed drinking water service in 2015, whereas 844 million people still lacked even a basic drinking water service.
Energy
- If people worldwide switched to energy efficient lightbulbs, the world would save US$120 billion annually.
- Despite technological advances that have promoted energy efficiency gains, energy use in OECD countries will continue to grow another 35 percent by 2020. Commercial and residential energy use is the second most rapidly growing area of global energy use after transport.
- In 2002 the motor vehicle stock in OECD countries was 550 million vehicles (75 percent of which were personal cars). A 32 percent increase in vehicle ownership is expected by 2020. At the same time, motor vehicle kilometers are projected to increase by 40 percent and global air travel is projected to triple in the same period.
- Households consume 29 percent of global energy and consequently contribute to 21 percent of resultant CO2 emissions.
- The share of renewable energy in final energy consumption has reached 17.5 percent in 2015.
- The global electrification rate reached 89 percent in 2017 (from 83 percent in 2010), still leaving about 840 million people without access
- Between 2010 and 2017, the percentage of the population relying on clean cooking solutions grew by an annual average of 0.5 percentage points.
- The global population without access to electricity fell from 1.2 billion in 2010 to 840 million in 2017.
Food
- Each year, an estimated 1/3 of all food produced – equivalent to 1.3 billion tons worth around $1 trillion – ends up rotting in the bins of consumers and retailers, or spoiling due to poor transportation and harvesting practices
- 38 million children under the age of 5 were overweight or obese in 2019.
- Land degradation, declining soil fertility, unsustainable water use, overfishing and marine environment degradation are all lessening the ability of the natural resource base to supply food.
- The food sector accounts for around 30 percent of the world’s total energy consumption and accounts for around 22 percent of total Greenhouse Gas emissions.
Goal 12 Targets
12.1 Implement the 10-year framework of programs on sustainable consumption and production, all countries taking action, with developed countries taking the lead, taking into account the development and capabilities of developing countries
12.2 By 2030, achieve the sustainable management and efficient use of natural resources
12.3 By 2030, halve per capita global food waste at the retail and consumer levels and reduce food losses along production and supply chains, including post-harvest losses
12.4 By 2020, achieve the environmentally sound management of chemicals and all wastes throughout their life cycle, in accordance with agreed international frameworks, and significantly reduce their release to air, water and soil in order to minimize their adverse impacts on human health and the environment
12.5 By 2030, substantially reduce waste generation through prevention, reduction, recycling, and reuse
12.6 Encourage companies, especially large and transnational companies, to adopt sustainable practices and to integrate sustainability information into their reporting cycle
12.7 Promote public procurement practices that are sustainable, in accordance with national policies and priorities
12.8 By 2030, ensure that people everywhere have the relevant information and awareness for sustainable development and lifestyles in harmony with nature
12.A Support developing countries to strengthen their scientific and technological capacity to move towards more sustainable patterns of consumption and production
12.B Develop and implement tools to monitor sustainable development impacts for sustainable tourism that creates jobs and promotes local culture and products
12.C Rationalize inefficient fossil-fuel subsidies that encourage wasteful consumption by removing market distortions, in accordance with national circumstances, including by restructuring taxation and phasing out those harmful subsidies, where they exist, to reflect their environmental impacts, taking fully into account the specific needs and conditions of developing countries and minimizing the possible adverse impacts on their development in a manner that protects the poor and the affected communities
Links
The 10-Year Framework of Programmes on Sustainable Consumption and Production
UN Environment Programme – Resource efficiency
FAO website for Sustainable Production
International Telecommunications Union
UNDP page for Sustainable Production & Consumption


10 Comments
Pingback: coffee shop jazz
Pingback: Highbay
Pingback: บริษัทกำจัดปลวก
Pingback: https://narkolog118.ru/wp-content/uploads/2015/01/7669.html
Pingback: พูลวิลล่า
Pingback: ร้านทำเล็บเจลใกล้ฉัน
Pingback: เช่ารถตู้พร้อมคนขับ
Pingback: เช่าเครื่องสเลอปี้
Pingback: Per capita CO2 emissions compared to global average - Bergensia
Pingback: Green Growth Is Failing: Study Reveals Why Decoupling Claims Don’t Hold Up - Bergensia