
Reposted 5. December 2025. Update June 7. 2025:
Atmospheric carbon dioxide (CO2) concentrations have peaked for the year at 430.5 parts per million (ppm).
The 2025 peak is 3.6 ppm higher than last year, marking the second-largest May-to-May increase in the 67-year Mauna Loa record. In 2023, the CO2 peaked at 424 ppm.
Limiting global warming to 1.5°C would require the CO2 rise to slow; in reality, the opposite is happening. Even without the boost from El Niño last year, the CO2 rise driven by fossil fuel burning and deforestation would now be outpacing the IPCC’s 1.5°C scenarios. – Richard Betts, who leads the Met Office CO2 forecast team.
When researchers took the average readings for all 12 months in 2024, the average was 3.58 parts per million (ppm) higher than the average for 2023. That broke the record for the most significant jump set in 2016 of 3.41 ppm. Ralph Keeling, who leads CO2 measurements at UC San Diego’s Scripps Institution of Oceanography, said that the climate pattern El Niño played a role in both instances.
The March 15, 2024, daily CO₂ at Mauna Loa, Hawaii, was 427.93 ppm, highest in the NOAA record, which even more remarkable since the annual CO₂ maximum is typically reached in May, so even higher values are likely to be reached over the next few months. https://t.co/p2ggISSntF pic.twitter.com/VYQfojtw1S — Sam Carana (@SamCarana) March 17, 2024
420.30 parts per million (ppm) CO2 in air 26-Jan-2022 https://t.co/kUgI1WKg1U correction to 26-Jan-2022
— Keeling_Curve (@Keeling_curve) January 27, 2022
First posted on Bergensia February 3, 2022 – updated March 17. 2024 with a new all-time high ppm of 428. Latest CO2 reading April 14. 2024: 430,06 ppm – data from the most recent month is preliminary.
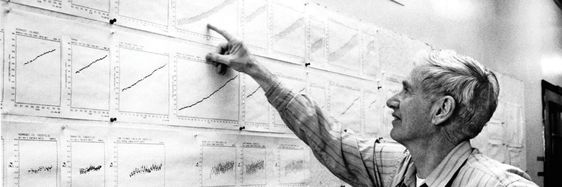
Wikipedia: The Keeling Curve is a graph of the accumulation of carbon dioxide in the Earth’s atmosphere based on continuous measurements taken at the Mauna Loa Observatory on the island of Hawaii from 1958 to the present day. The curve is named for the scientist Charles David Keeling, who started the monitoring program and supervised it until his death in 2005.
Keeling’s measurements showed the first significant evidence of rapidly increasing carbon dioxide (CO2) levels in the atmosphere.[1] According to Naomi Oreskes, Professor of History of Science at Harvard University, the Keeling curve is one of the most important scientific works of the 20th century.[2] Many scientists credit the Keeling curve with first bringing the world’s attention to the current increase of CO2 in the atmosphere.[3]
The Earth’s Atmosphere
The majority of the Earth’s atmosphere is composed of a mixture of only a few gases: nitrogen, oxygen, and argon. Combined, these three gases comprise more than 99.5% of all the gas molecules in the atmosphere. These gases, which are most abundant in the atmosphere, exhibit almost no effect on warming the Earth and its atmosphere, as they do not absorb visible or infrared radiation. However, there are minor gases that comprise only a small portion of the atmosphere (approximately 0.43% of all air molecules, with most being water vapor at 0.39%) that do absorb infrared radiation. These “trace” gases contribute substantially to the warming of the Earth’s surface and atmosphere due to their ability to contain the infrared radiation emitted by the Earth (see below for details on the Greenhouse Effect). Since these trace gases influence the Earth in a manner somewhat similar to a greenhouse, they are referred to as GreenHouse Gases, or GHGs.
Results and interpretation
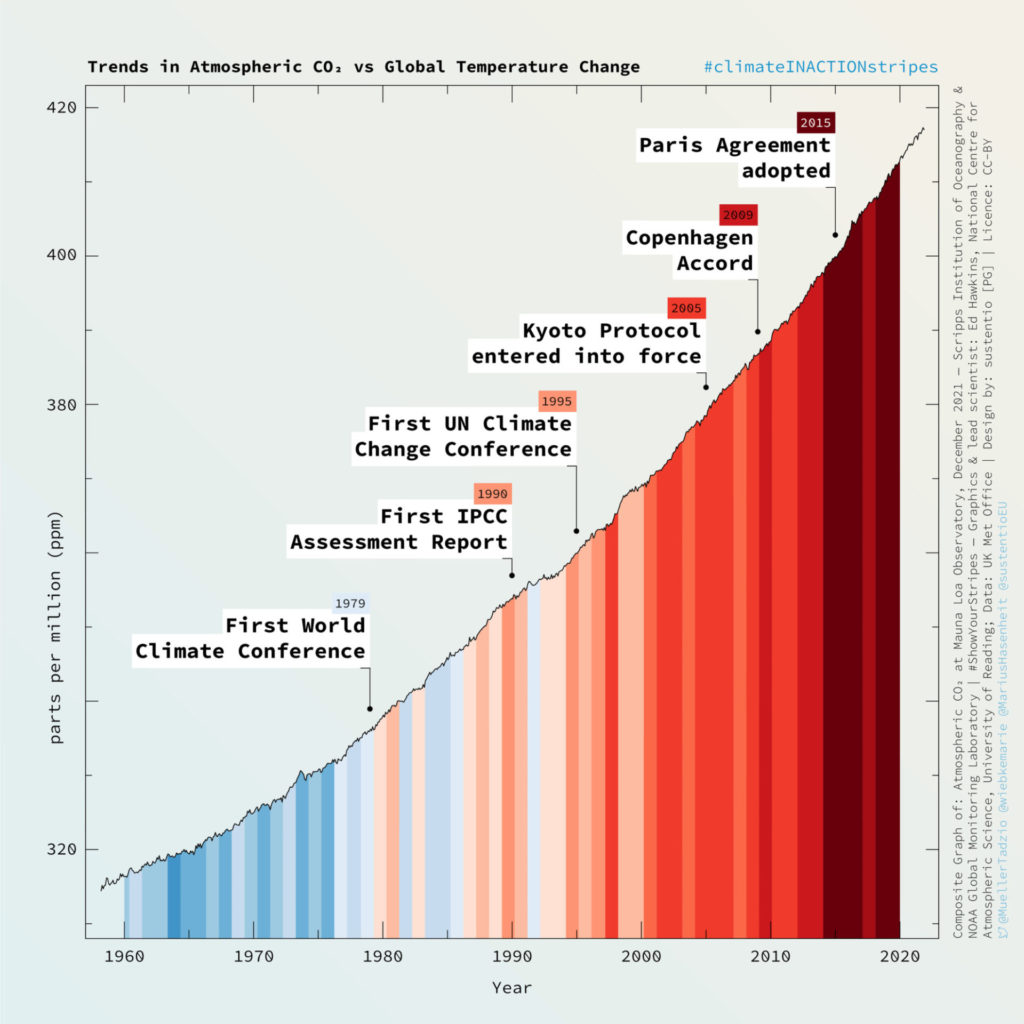
The measurements collected at Mauna Loa Observatory show a steady increase in mean atmospheric CO2 concentration from 313 parts per million by volume (ppmv) in March 1958 to 406 ppmv in November 2018 [15], with a current increase of 2.48 ± 0.26 (mean ± 2 standard dev) ppmv CO2 per year.[16] This increase in atmospheric CO2 is due to the combustion of fossil fuels and has been accelerating in recent years. Since CO2 is a greenhouse gas, this has significant implications for global warming. Measurements of CO2 concentration in ancient air bubbles trapped in polar ice cores show that the mean atmospheric CO2 concentration was between 275 and 285 ppmv during the Holocene epoch (9,000 BCE onwards) but started rising sharply at the beginning of the nineteenth century.[17]
The Keeling Curve also shows a cyclic variation of approximately 5 ppmv per year, corresponding to the seasonal change in the uptake of CO2 by the world’s land vegetation. Most of this vegetation is found in the Northern Hemisphere, where the majority of the land is located. From a maximum in May, the level decreases during the northern spring and summer as new plant growth removes CO2 from the atmosphere through photosynthesis. After reaching a minimum in September, the level rises again in the northern fall and winter as plants and leaves die off and decay, releasing CO2 back into the atmosphere.[10][12]
Passing 400 ppm in 2013
On May 9, 2013, the daily mean concentration of CO2 in the atmosphere measured at Mauna Loa surpassed 400 parts per million (ppmv).[24] Estimates of CO2 during previous geologic eras suggest that CO2 has not reached this level since the mid-Pliocene, 2 to 4 million years ago.[25]

Atmospheric carbon dioxide (CO2) concentrations have peaked for the year at 430.5 parts per million (ppm).
The 2025 peak is 3.6 ppm higher than last year, marking the second-largest May-to-May increase in the 67-year Mauna Loa record. In 2023, the CO2 peaked at 424 ppm.


16 Comments
Pingback: Heatwaves and Fires Scorch Europe, Africa, and Asia - Bergensia
Pingback: สล็อตเว็บตรง
Pingback: Singapore Hotel
Pingback: เค้กลาบูบู้
Pingback: read
Pingback: บริการรับฝาก iPad
Pingback: เทรดทอง
Pingback: Fake site and will take your money! Beware of uplinke.com Spam and make your site go down. Too good to be true SCAM
Pingback: rondreis gambia
Pingback: betnew99
Pingback: browse this site
Pingback: Management
Pingback: dark168
Pingback: ปั่นสล็อตออนไลน์ทุนหลักร้อย ได้กำไรหลักหมื่น
Pingback: Trump admin wants to kill the most indisputable evidence of human-caused climate change by shutting Mauna Loa Observatory on Hawaii - Bergensia
Pingback: Per capita CO2 emissions compared to global average - Bergensia