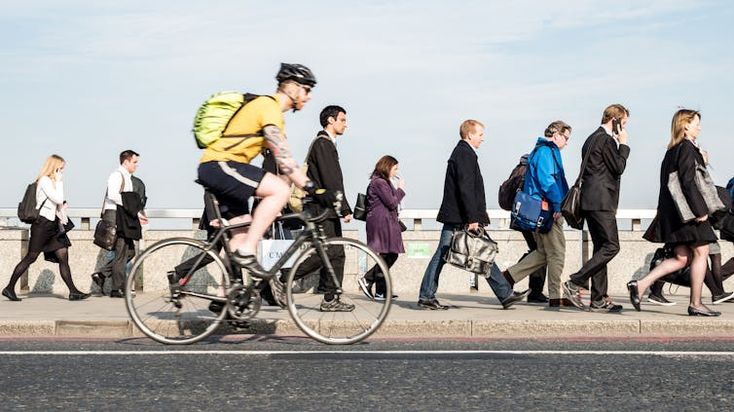
The Class sketch is a “genuinely timeless sketch, ingeniously satirising the British class system” first broadcast in an episode of The Frost Report on 7 April 1966. Written by Marty Feldman and John Law. Featuring John Cleese, Ronnie Barker and Ronnie Corbett.
The Tories have been in power since 2010. In the same period, national life expectancy growth has diminished compared to the G7 and Nordic countries, and inequality is growing; the UK is now the second most economically unequal country in Europe after Bulgaria, according to (OECD). The UK is now falling behind most comparable European countries on maternal mortality, which is considered a warning signal for the wider health system.
A relative worsening of population health is evidence that all is not well. It has historically been an early sign of severe political and economic problems
Dr Lucinda Hiam of Oxford University
While politicians invoke global factors, especially the effects of the pandemic and the invasion of Ukraine, the reality is that, as in the 1950s, the country suffers from major structural and institutional weaknesses.
Prof Martin McKee, of the London School of Hygiene & Tropical Medicine
Height is highly correlated with socioeconomic position
by Michael Marmot, professor of epidemiology at University College London, director of the UCL Institute of Health Equity, and past president of the World Medical Association
In the Whitehall study, a long-term investigation of the health of British civil servants, it was found the higher people are, the higher they go. People at each rung on the employment ladder are taller, on average, than those below them, and shorter than those of higher status. It’s possible that being taller gets you promoted. More likely, the social circumstances of early childhood, including good nutrition, are linked not only to height, but to educational and social success. Height, then, is both an outcome of conditions in childhood and an indicator – by which I mean that shorter height is a likely reflection of adverse conditions that will affect other aspects of children’s development: cognitive, linguistic, emotional.
The link between height, nutrition and social circumstances can already be seen in childhood. There is a neat gradient – the greater the deprivation, the shorter the child. The height of individuals is mainly determined by their genes, but the differences between groups, and trends over time, are largely the result of differences in exposure to nutrition, infections, stress and poverty.
It is in that context that a report of height in five-year-old children from 200 countries has alarming news for the UK. In 1985, boys and girls in the UK were shorter than those in 68 other countries. We slipped down the rankings, steadily, so that by 2019, UK boys ranked 102, and girls 96. By five years of age, UK children are, on average, 7cm shorter than children in the Netherlands.
The slower increase in average height of five-year-olds in the UK compared with other countries, and the slippage down the global height rankings, was more or less continuous from 1985. We weren’t doing well, but it was not obviously linked to Conservative or Labour governments. But then, in the mid 2010s, something dramatic happened – the average height of five-year- olds went down. This is unlikely to be the result of ethnic mixing of the population. The average height of five-year-olds also declined in the US.
If height is an indicator of social conditions in childhood, including nutrition, is it possible that social conditions for children in the UK are worse than in many other countries and deteriorated during the decade after 2010?
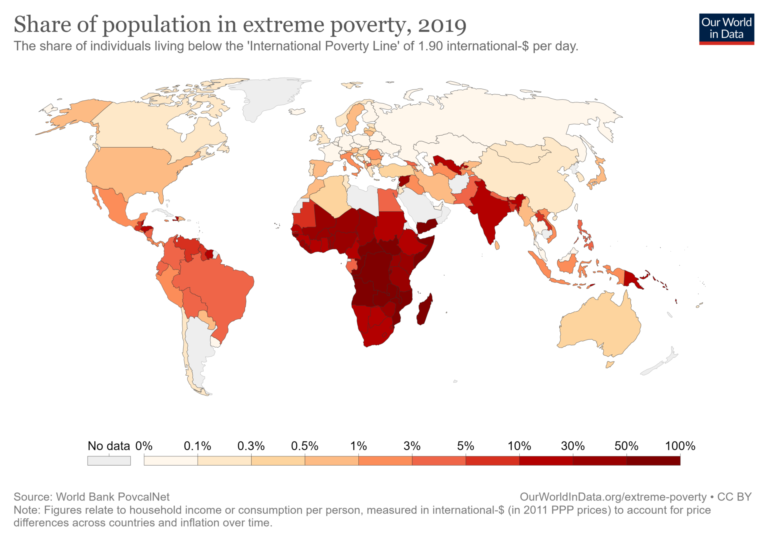
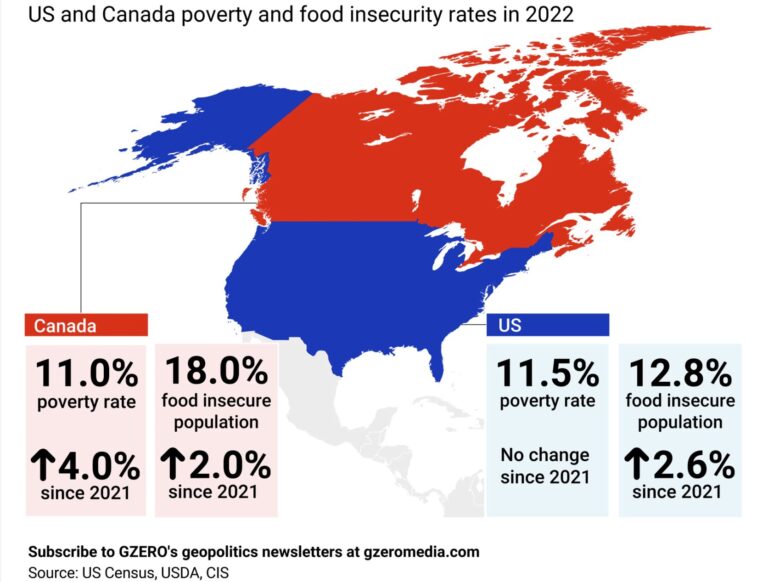
It is highly plausible. Unicef reports child poverty among 41 OECD (mostly rich) countries. It uses a relative measure of poverty: children living in households at less than 60% median income. On this measure, the UK ranks 31 out of 41 countries (1 is the best); the US ranks 38. Using the same measure, where people are relative to others, child poverty in England, after housing costs, rose from 27% in 2010 to 30% in 2019. The government prefers an absolute measure of poverty – one that bizarrely takes relative poverty in 2010/11 as the standard – because that looks more favourable. A better absolute measure is the Joseph Rowntree Foundation’s minimum income standard. Under this measure, 39% of children were in poverty in 2008/9; 40% in 2020/21.
Not only is child poverty high, and rising, in the UK; we don’t spend very much on young children. The same Unicef comparison looks at public spending on child education and care for children aged nought to five. The average for OECD countries is $6,000 per child per year. Norway and Sweden spend around $12,000, France close to $9,000. In the UK, we spend $4,000, limping along below average. The US is worse, at $3,000.
In our evidence to the Covid inquiry, Clare Bambra, professor of public health at Newcastle University, and I concluded that we entered the pandemic with “public services depleted, health improvement stalled, health inequalities increased and health among the poorest people in a state of decline”. David Cameron and George Osborne, the architects of a decade of austerity, looked at the evidence of the damage their policies had caused – and rejected it.
When they were prime minister and chancellor, Cameron and Osborne argued that austerity led to economic growth. They have been proved wrong. After the global financial crisis of 2007/8, median incomes fell sharply in the UK, performing worse than European peers. Household disposable incomes are lower than they were 18 years ago.
Worse than the overall average performance of the economy, it is really bad to be poor in Britain. Incomes of the poorest 10% are way below those in other European countries. It means that people of low income cannot afford the basics of food, shelter and home heating. It is likely that the rise in child poverty, the cuts to health care funding per person, after ageing of the population is taken into account, and the regressive cuts to spending by local authorities, have all played a part in the dismal health picture we saw pre-pandemic.
It is precisely evidence such as Bambra’s and mine to the Covid inquiry that will feed into a new Global Council on Inequality, Aids and Pandemics, set up by Unaids, that I will co-chair with economist Joseph Stiglitz and the first lady of Namibia, Monica Geingoss.
Both Conservatives and Labour in Britain put high priority on economic growth. I would rather see growth and reduction in inequalities in the height of five-year-old children. That way we will know that we have an economy that is really delivering for the health and wellbeing of all.
Michael Marmot is director of the Institute of Health Equity at UCL


Comments are closed.