
We must never forget that the cheapest and most environmentally friendly energy is the one we do not use, while the most expensive and destructive energy is the one we thought we had, but which was never delivered!
Jan Emblemsvåg, Energi & Natur
Wind power and costs in Norway
To understand how wrong the arguments of many Norwegian politicians about renewable energy are, one must first understand how the system works. What are the real societal costs that wind power imposes on us, through destroyed nature, birdlife, and insects, replacement power, material use, and land use?
OPINION
by Jan Emblemsvåg, ph.D original first published in Norwegian in Energi & Natur / Nettavisen
Longread that will give you a thorough insight into the consequences of the large wind power developments.
The author would like to thank Kjell Traa, Mads Løkeland-Stai, Sverre Sivertsen, Sveinulf Vågene, and others who wish to remain anonymous. This document is written as a popular science input with the simplifications it entails. Readers are encouraged to read all the references that the document contains, and feel free to read many more as well. Please contact.
E24 reported last week that the Conservatives and the Labor Party believe that Norway must develop more renewable energy to ensure enough electricity to the country to avoid high electricity prices.
Norway needs just under 150 TWh in a normal year, and NVE estimates 159 TWh consumption in 2030, while Statnett expects 172 TWh. With this increase in demand, electricity prices will rise significantly in relation to current electricity prices, unless sufficient production of electricity is ensured domestically.
Wind power varies with the wind. The supply of wind power is therefore governed by “supply” and is, therefore, a fundamental breach of the principle of “demand management” (note1). This breach results in a number of costs that do not appear in the calculations used by the wind power industry today (note2). The most important cost that is ignored is the opportunity costs imposed on others in the power supply, which happens in the form of lost income and extra costs.
In many ways, wind power can be compared to a power supplier that promises the cheapest electricity in the market. The problem is that it only works when the wind is blowing properly, so then you have to get another power supplier when the wind blows too much or too little. Yes, this is probably cheap, but it has low value because you have to use another power supply most of the time.
The argument that “this wind power plant” provides power to so and so many households, is therefore misleading. It provides power to so and so many part of the time, some more another part of the time, and very few the rest of the time. Talking about wind power using average figures is very misleading because the power supply is a balancing act in the present, which is explained further later in this text.
In addition, the wind industry has negotiated very favorable long-term agreements in the name of the green shift, and this destroys the economy for many others who eventually either close down or are no longer allowed to operate (such as the German nuclear power plants). The result is an energy system that is becoming more and more unstable (note3) and therefore more expensive. Furthermore, we must not forget that the costs of major power outages are in the billions. International conditions are good pointers on where this is heading.
A short description of how the system works
To understand how wrong the arguments of these politicians are, one must first understand how the system works. The main points of such an analysis are that:
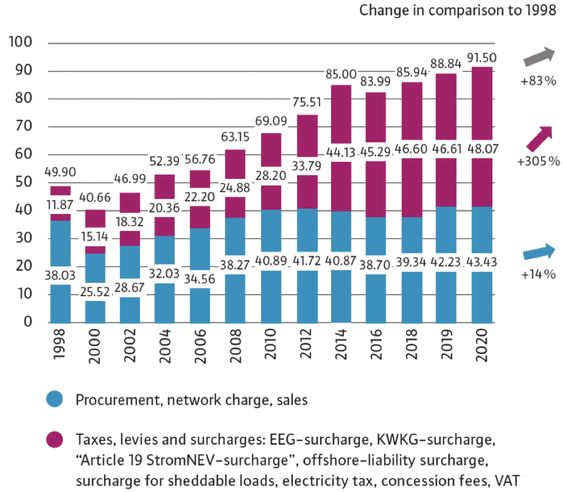
1. Energy prices have increased by about 32 percent more than inflation in Norway would indicate in recent years (2021 is not included).
2. Despite large-scale development of wind power, production is very low for about a third of the year and at times almost zero
3. wind power produces electricity regardless of the demand for electricity.
The first is a result of imported prices from Europe, which is thus a hidden subsidy of Norwegian wind power and green certificates. The price increase beyond inflation amounts to approximately NOK 20 billion a year, and it will increase sharply in 2021 and beyond.
In 2021, Norwegian power producers supply electricity to Europe despite the low degree of filling in the reservoirs. Winter can therefore be difficult for many, especially during the period when it is dark, cold, and often windless, and then wind power does not help.
The Germans have even given the phenomenon its own name – Dunkelflaute.
The winter of 2021 should warn the power industry and politicians, especially when one should know that 20 percent of Norwegian households are completely dependent on electricity. The situation in Europe is driven by a combination of several factors. One is low wind power production which leads to high gas consumption since gas power is the balancing power for wind power in 26 OECD countries. Now in 2021, Germany has 25 percent lower wind power production, gas consumption has increased by 15 percent, black coal has increased by 36 percent and lignite has increased by 44 percent. In 2021, they are on track for the highest increase in greenhouse gas emissions since 1990.
Energiewende subsidies is a threat to the German economy
In all places where wind power receives a large share of electricity production, they experience high costs. Look at Ontario and many other places, but Germany and Ireland are good examples in their own way. Figure 1 is from Germany and shows what has happened to the price level. Until 2015, the renewable industry in Germany was subsidized by 125 billion euros (note4). In the period 2015-2019, subsidies increased by a further 160 billion euros, and the results are extremely to the detriment of costs, says Germany’s Auditor General (note5).
This situation is exacerbated by the high freight rates internationally due to shipping companies scraping many older ships during covid-19 due to good steel prices but does not know what to build due to the great market uncertainty surrounding the fuel situation in the future created by political signals. This will worsen even more due to underinvestment in gas production in the years ahead. A third factor is that the East pays more for LNG so that many European countries now again use more coal power to prevent the European grid from blackening and then emission taxes mean little – especially when those costs can be left on to the customers’ bills. The fourth factor is that subsidies are increasing and must be covered.
2020 was a new record year for subsidies of as much as 30.9 billion euros (note6). The result for the Germans is that electricity prices are about 45 percent above the European average (note7) and they will continue to increase (note8). In their latest report, the criticism from the German Office of the Auditor General is even sharper – they say that the so-called green transition, Energiewende is a threat to the German economy, Germany’s industry, and population (note9). Unfortunately, there will be an additional 20,000 to 35,000 billion in costs in the future (note10).
One of the world’s foremost energy experts, Vaclav Smil, writes that in 2000 Germany had an installed capacity of 121 GW with a power production of 577 TWh (note11). In 2019, Germany had 80 percent more capacity (218 GW), but electricity production increased by only 5 percent (607 TWh) relative to production in 2000. This is a very extensive investment in capacity, but with a catastrophically poor utilization rate. The reason is that wind and sun are unstable sources of power. Ireland also has some of the highest energy prices in Europe, beaten only by Germany, Denmark, and Belgium. Ireland also has a record renewable share of power supply, but the effect on emissions is limited and they will never be able to establish a low-carbon power supply because the entire power supply depends on natural gas for stability and electricity production. In fact, the growth of wind power has led to about the same growth in natural gas consumption, so that in many countries the wind industry and the gas industry are close allies (note12).
Emission reductions are (note13) also small in relation to costs – also in Germany. The newspaper Frankfurter Allgemeine writes (note14) that with the subsidy record in 2020 and only a reduction of 80 million tonnes (note15), Germany could have bought quotas in the European quota system of as much as 1.24 billion tonnes (!). In other words, emission reductions and costs are out of all proportions.
When wind power costs so much internationally and emission reductions are so marginal, why should Norway focus on developing wind power for its own consumption and possible export?
Wind power and hydropower
It is often said that the situation for Norway is different than for many other countries due to hydropower. There is potentially some truth in this, as we shall see, but not as it is today. Analyzes of hourly data for the Norwegian power system in 2019 and 2020 provide several interesting findings.
There is a weak positive connection (correlation) between wind power and hydropower, ie when hydropower production increases, wind power production hardly increases. In other words, hydropower is not used as a battery for wind power. Then the correlation should have been noticeably negative. It is the prices in the market that matter.
If hydropower is to function as a battery for wind power, binding procurement agreements must be entered into between the wind power plants and the hydropower plants. This means that the wind power plants must purchase capacity with the hydropower plants in advance so that the wind power together with the purchased share of the hydropower can guarantee, for example, 80 percent of the installed wind power output on the market at any given time. This poses a financial risk which means that wind power becomes more expensive. It should now be added that some agreements have been made between wind power plants and hydropower plants that have improved this situation somewhat, but it is in such a small proportion that it does not show in the figures for Norway.
In addition, the wind industry should cover the increased maintenance and wear and tear costs of the hydropower plants since these will cover rapid/unpredictable variations produced by the wind power plants (note15). Today, these costs are illegally transferred to hydropower plants.
Then we have some who believe that electric batteries are the way to go. Detailed analysis shows that it will be extremely expensive, and using electric cars as batteries is not realistic either. Analysis from the USA shows that this can provide only three hours of average power supply (note16). Afterward, when these vehicles are to be charged, the problem becomes even greater than it was.
Secondly, wind power production is very variable (see Figure 2). The vertical axis in Figure 2 shows the number of MWh (or thousand kWh), while the horizontal axis shows the number of hours calculated from the New Year so that 4759 is hour number 4,759 calculated from the New Year at 00:00. The entire horizontal axis thus covers one year, hour by hour. 2020 is presented over 2019 so that the two graphs are directly comparable in time.
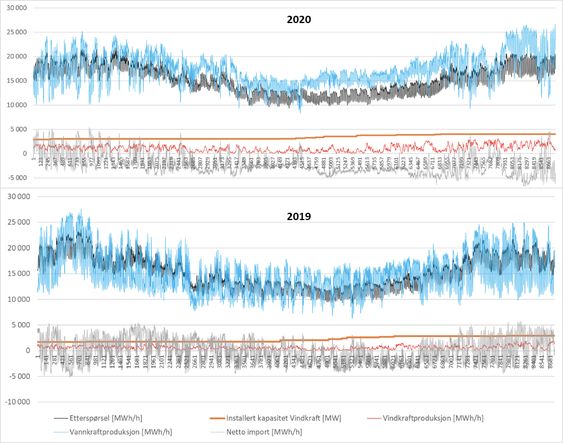
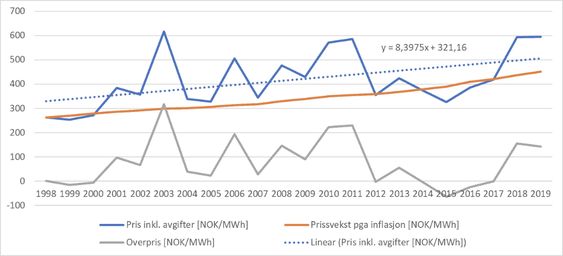
In 2019, the Norwegian electricity market was in balance on an annual basis, but there were large volumes of imports and exports during the year. In 2020, there were a lot of exports mainly due to a wet year. The challenges with this are that the price level in Norway is increasingly driven by the price level in Europe. It is clear from Chart 3 that prices have risen by about 32 percent more than inflation would suggest. This is partly due to imports/exports and partly subsidies. The left part of the graph until about 2015 is mainly driven by the import/export effect, while from 2015 onwards the subsidies for wind power will be at the top. It is difficult to describe the effects very clearly as Norway is part of a larger market (Nordpool), but Figure 3 gives an indication. Subsidies will be discussed later.
The situation in Figure 2 can also be presented as in Figure 4. By sorting the data by falling values on demand (largest first and least in the end), we see in the top figure that it is hydropower that follows demand, but that wind power is as « noise »at the bottom. In the lower figure in Figure 4 below, the demand data have been removed and the data are sorted by declining hydropower production (largest first and smallest last). Then we see that exports are also driven by hydropower, while wind power is once again at the bottom as “noise”.
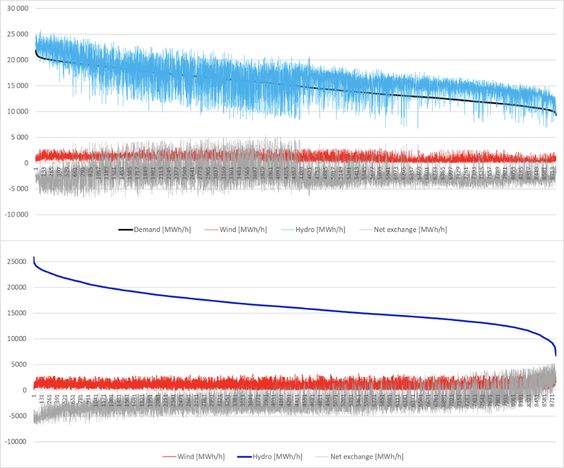
In other words, wind power is relatively decoupled from demand. The correlation between wind power production and demand is actually only 30 percent, which is due to the fact that in Norway we have the most wind in the winter when we also use the most electricity. The correlation between hydropower production and demand is as much as 70 percent, while hydropower production has only a 10 percent correlation with wind power production. From this, we understand that hydropower is not used as a battery for wind power, and that wind power is to a small extent able to satisfy demand. The only positive thing about wind power production in Norway is that it produces more in the winter than in the summer. Unfortunately, production is not reliable so you can not rely on wind power as an energy source even in the part of the year with the most wind.
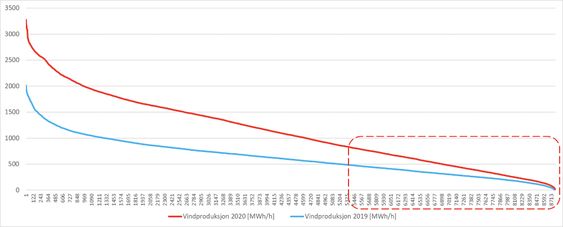
This can also be shown by comparing the two curves for wind power production for 2019 and 2020 (see Figure 5). As we see, the increase in production is relatively large – approximately 1,000 MWh per hour. A third of the graph to the right (in the dotted box) shows the problem. Despite the sharp increase in installed wind power capacity from 2019 to 2020, production – when there is little wind – is just as bad almost no matter how many wind turbines you have. This is due to the obvious, simple fact that all turbines stand still when there is no wind.
The only real way to solve this challenge is to develop wind over large geographical areas with different weather conditions. Unfortunately, we are talking about huge areas of land. Even the continental United States is too small to ensure such geographical diversification of production (note17). Even if such a geographical diversification were to be achieved by linking the entire European continent, the problem of fluctuating production would still not be solved. Another study (note18) shows that you need four wind power plants to be able to secure production from a single one under all the most ideal conditions. This clearly means that if you are to be able to produce 100 MW with very high reliability – such as with hydropower – then you need 4 wind power plants of every 100 MW distributed geographically so that they never experienced the same weather system. One should not have looked much at the weather forecasts over Europe until one realizes that this is very difficult to achieve.
Nevertheless, some claim that because the electricity certificates received almost zero value in 2020, the wind power industry does not need any subsidies. It is a statement based on a circular argument because it is the renewable energy in Europe that has led to sharply increased prices, and of course you do not need subsidies in the normal sense. This is obvious, because;
…1% increase in the exporter’s electricity price reduces energy trade by an average of 0.7%, whereas a similar increase in the importer’s electricity price increases energy trade by an average of almost 1%.
Batalla-Bejerano, J., J. Paniagua and E. Trujillo-Baute (2019). «Energy Market Integration and Electricity Trade.»
Economics of Energy & Environmental Policy 8(2): pp. 53-67.
The above means that electricity trade is sensitive to electricity prices and vice versa so that when electricity prices in Norway have increased more than inflation should indicate, it must be due to imported price levels earlier in the year while now it has also received a local cut of subsidies of wind power.
The need for subsidies can easily be demonstrated without going to Germany where the subsidies are very large. It gives high prices on the continent which gives good export prices to the Norwegian power industry and large profits. Authors of an article in the UK claim (note19) that the wind industry will soon give something back to society in the form of “negative subsidies”. The article falls into the same circular trap. In short; they assume that the price level is independent of themselves and then argue that they do not need subsidies. If the authors had a valid argument, it is at least strange that when reviewing the accounts of all Danish and British wind power plants, one finds increasing costs over time and this is inconsistent with the power industry’s claims (note20). Other researchers find in a review of 29 wind power plants in the UK that the real costs are about twice as high as those that the industry uses externally in the form of LCOE (average life cycle cost for energy) number (note21).
The reason for this large difference is that the wind power industry uses a narrow definition of costs despite the fact that this definition is well documented to be very misleading (note22). This narrow definition gives them advantageous numbers, but the numbers are fundamentally misleading. For Norway, the practical consequences of this have had less effect so far since wind power as a whole makes up a small proportion of the power supply and today costs about the same as hydropower (note23) when all alternative costs are not included.
We can still try to estimate what this means in the Norwegian context. Since we are unable to separate the subsidies in Norway from the gain on export and the price on import, and because we have a common market (NordPool), we must look at everything as a whole. If we assume a sensible development in electricity prices – which over time should have followed inflation indicated by the trend line in Chart 3 – we find an overpricing in the market of 32 percent. If we use the figures for 2019, this amounts to NOK 19.1 billion. The electricity certificates amount to an additional NOK 1.5 billion. Rounded, the party costs about 20 billion a year.
When the share of wind power increases in the future, the consequences will increase and become far more visible as everywhere else where wind power makes up a large share of the power supply. Therefore, we must expect an increase in electricity charges, fixed link charges, and similar charges, often hidden with the argument that the line network must be modernized. That the line network must be modernized in any case is true to a certain extent, but this is mainly due to the variation in wind power production and that consumption is often far away from where wind power is produced. This means that the line network must be dimensioned to handle the large electricity production when there is a lot of wind, and it will be more geographically extensive since the wind power plants are scattered around.
Another factor to include in the discussion about increasing fixed link fees (etc.) is that negative prices – which we have seen due to overproduction of electricity in 2020 – will hit other power producers hard because wind power producers usually have price guarantees in their contracts, while the others do not have such contracts. To prevent these other power producers from going bankrupt, they must be guaranteed income in another way and then fixed link fees are an alternative. You can not let these producers go bankrupt because wind power is so unreliable that if you need spare capacities otherwise it will lead to power outages. In other words, this is a good example of an alternative cost that wind power imposes on others, and thereby also society.
When there is no wind, the challenges are similar for the line network. In 2020, hourly production for wind power was as low as 8.3 MWh / h at a specific time (!). It is the size of a river power plant. If this is to be compensated for, one must secure power supply from far and near to secure the power supply locally, but Norway constitutes too small a geographical area to secure the power supply when developing the line network, as mentioned earlier. In short, this is due to the fact that the weather systems often have a large geographical distribution. When the wind turbines stand still in one place, they stand still in many other places as well. The solution to this is import or reliable production such as nuclear power.
After the Germans closed down their nuclear power plants and invested in renewable energy, they have experienced this so many times that they have given the situation the descriptive name “Dunkelflaute” (note24) (dark and quiet). The combination of low sunlight and calm winds when there is cold high-pressure weather in winter is an insurmountable problem for renewable energy, and hydropower is unable to compensate for this in either Norway or Europe.
The winter of 2021 – with the high electricity prices many experiences – should give us all a warning. With 20 percent of Norwegian households dependent on electricity for everything (note25), the increased dependence on wind power combined with little wind when it is cold in winter is a major societal risk. This risk can quickly occur when it is known that the continent will lose about 100 GW with reliable capacity in the next few years (note26). For example, Germany will go from net exporter to net importer. So who in Europe will eventually have the surplus to save the rest? It is time that we in Norway have a public debate based on facts and realism, otherwise, we will pay very dearly. Others have already had to pay dearly in the form of externalities.
Wind power externalities
Externalities are conditions that are not included in the economic analysis, but which must be covered by society or nature. In the future, these may have significant consequences for life, health, the environment, and the global economy. There are many issues that need to be highlighted in this context for the wind power industry.
First, the environmental analyzes use databases and data sets where variation and uncertainty around data quality are often not understood, where one has misunderstood and/or the whole thing has been misused (note27). In addition, systems with different system boundaries are often used so that it is unclear what is actually compared to what. The variations in results can therefore be large (note28), and the alleged emission reductions from the wind industry are therefore difficult to quantify.
Secondly, a number of wind farms have been built on bogs. Greenhouse gas emissions are ignored in most environmental analyzes, despite the fact that plants built on bogs with a certain depth produce such large emissions that the plants will never have a positive contribution to the climate accounts34. As biochemist Mike Hall put it in 2009 (note29);
…wind farms [built on bogs] may eventually emit more carbon than an equivalent coal-fired power station.
Third, these environmental analyzes overlook major problems associated with rare earth elements (Rare Earth Elements, referred to as “REE” in English). However, there are some analyzes of permanent magnets (note30), which are used on large and advanced wind turbines and thereby increasingly seen in the light of the fact that wind turbines are steadily increasing in size. A major problem is the poor data quality in China. Even the manufacturers themselves can not be sure of their own supply chain in China, as the industry man Ryan Castilloux (note31) says that most manufacturers;
…don’t have good visibility as to the source of their REEs.
This is not difficult to understand after reading about China’s production games (note32). This is also a problem for the country because as much as a third of the REE delivered to the market is directly based on theft, smuggling, and illegal activities (note33).
The permanent magnets usually contain neodymium, praseodymium, terbium and dysprosium (note34). Typically, an average permanent magnet in the wind industry contains about 28.5 percent neodymium, 4.4 percent dysprosium, 1 percent boron, and 66 percent iron, and weighs up to 4 tons (note35). Unfortunately, permanent magnets without REE are by far the same quality (note36), and there are major uncertainties regarding reuse and recycling (note37). In the USA alone, it is estimated that as much as 4,600 million tonnes of REE will be used if the growth targets for the wind industry are to be reached (note38).
Another major problem is that the extraction and refining of REE take place under appalling conditions. The BBC describes the world’s largest and most important area – Bayan Obo, which contains about 70 percent of global REE deposits – as “hell on earth” (note39). Although not all extraction takes place in China, the share of refining in China is almost 100 percent and it is unlikely to change in the future (note40). There is also a great concern in relation to the emissions of radioactive waste since the REE deposits contain thorium and/or uranium(note41). Miners who extract REE for the renewable industry are exposed to 40-80 times higher doses than miners in the nuclear power industry (note42).
This mining also threatens wildlife. Mining for materials for renewable energy sources is more threatening to protected and remaining wilderness than mining for other purposes (note43).
Fourth, we do not have to go far to see how the wind industry kills large amounts of lives. In the Irish Sea, it is thoroughly documented that the seabird population fell by between 55 -80 percent near large offshore wind farms (note44). In Germany, it is estimated that 1,200 tonnes of insects are killed each year (note45). Insect death is a serious problem globally that will have major consequences for humanity if it continues (note46). It is beyond any doubt that this will have major financial consequences, but to calculate it is very difficult.
Fifth, the principle of “polluter pays” is systematically omitted in the economic calculations used by the wind power industry itself. This is a serious omission as it is expected that turbine blades globally will amount to 43 million tonnes of waste by 2050 (note47). This is a problem the industry believes will solve itself by recycling, but the fact is that there are no industrial recycling technologies for this (note48). In addition, the waste problem will only increase as the rotors grow as the volume grows 8 times for each doubling in rotor length with the same material and design (note49).
Maybe the wind power industry should pay into a fund for the cleanup like the nuclear power industry has done for decades?
Finally, the land use of the wind power plants must also be mentioned. The interesting thing is that the area productivity is approximately constant over several decades and is 2.73 ± 0.5 m2 / W (note50). This means that for the first time in world history we have a reversal of the trend of higher and higher energy efficiency (note51). This in turn means that thousands of square kilometers are necessary if large-scale wind power is to be used. Which is a cost for tourism and others that the wind industry does not yet have to compensate.
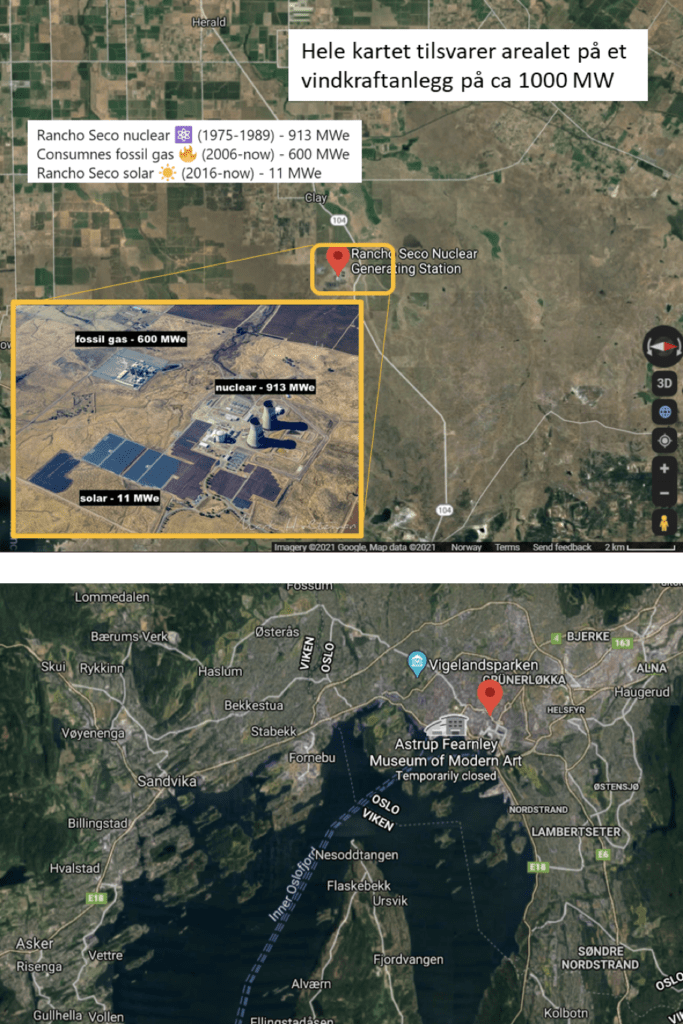
The more people there are on earth, and the more we have to utilize natural resources, the more valuable the untouched nature becomes. Then we must not reduce energy density. Mankind needs energy sources with high energy density without emissions. To illustrate the situation, we have created a figure using Google Maps that shows a situation in California where there is a decommissioned nuclear power plant, an operating gas power plant, and an operating solar power plant (see Figure 6). The small orange square at the bottom of the map is the area that the large orange square shows in greater detail with the three power plants.
The interesting thing is that the whole map (all the green) is the area a wind power plant needs to produce as much electricity as the nuclear power plant. Considering the significant difference with American nuclear power plants producing as much electricity as 93.5 percent of its theoretical production capacity (note52), while the wind power plants in Norway in 2019 and 2020 only managed 30.9 percent (note53). Taking into account the fact that the weather systems are often different over large geographical areas, the figures are much worse. In 2018, the Isar-2 nuclear power plant in Bavaria produced 11.5 TWh, while in comparison, the 6,100 wind turbines in Denmark produced approximately the same (13.9 TWh) (note54).
Embedded below, we see the Oslo area in relation to the wind farm. The wind farm is actually somewhat larger, despite the fact that the Oslo area contains fjord areas. If we correct for the fjord area, it means in practice that the entire Oslo area (including large parts of the area to Gardermoen) must have been filled with wind turbines to be able to produce as much as the nuclear power plant when it actually blows. Without wind, of course, wind power is helpless, and then you have to seize similarly large areas in three other places with different weather systems (as pointed out earlier). You also have to build power lines to connect all this. In addition, it is also likely that the more you expand, the more area-intensive the wind industry becomes because you often expand the best wind resources first (note55).
In this way, wind power is very area-intensive in every sense of the word.
The long-term consequences
With all the factors discussed so far, it is still not so difficult to indicate a little about the long-term consequences. We can divide them into five main themes that are connected – 1) technical challenges for the power system, 2). security of supply, 3). social economy, 4). consumer price and 5). trust in the population.
The technical challenges of renewable energy have two main components. One arises because wind power, in a class of its own, produces fluctuating production, and good wind resources are often found far away from consumers. This creates a need for increased line development. Due to the fluctuating production, the need for increased capacity in the transmission of electricity is even greater than in other power. Since you need 4 wind power plants to be able to secure the production of one under ideal conditions (Note56), this means that the line development must be very extensive. As we see from Figure 5, it is extremely demanding to secure enough deliveries from wind power for about a third of the year.
The second main component arises because the power system depends on synchronous energy sources to ensure voltage and frequency, and today this is ensured via the rotation of turbines (used in hydropower, nuclear power, gas power, coal power, etc). These turbines have a large mass and the rotating mass gives a moment of inertia which means that in the event of relatively large disturbances in the line network, they will still produce electricity tirelessly.
Neither wind power nor solar power is synchronous energy sources. They, therefore, have no stabilizing effect on the line network and in many cases, they fall off (trip) if disturbances occur, they themselves have problems (Note57). This means that suddenly a wind farm can fall out of the line network, which in turn gives an increased risk that more people will fall out unless the reserve power buffer is large enough. Therefore, it is necessary to increase the reserve buffer in the power system with an increasing share of renewable energy (Note58). This problem has been experienced in all line networks with a high proportion of renewable energy, see for example UK (Note59). In Ireland, which has the highest renewable electricity share in the world (Note60), a ceiling of a maximum 65% renewable share (Note61) has been set so far (Note62), with a political ambition to achieve 75% by 2030 (Note63). Even with these high levels of ambition, the annual average renewable share in 2019 is at only 34%. This is far from what can be called a carbon-neutral power system.
This gives two choices. Either one can continue with the enormous growth of renewable energy, and then one has to cut production to secure the line network and pay the wind power plants not to produce, or one has to find another solution such as nuclear power, energy-saving, and other technologies that work safely and reliably. It goes without saying that one will never achieve a carbon-neutral electricity supply using wind power, and the larger the share of wind power, the more expensive this solution will be.
The synchronization problem is also directly related to the security of supply itself. There is a limit to how large a reserve buffer one can have operational at any given moment, both for cost reasons and also for environmental reasons. This is because the emissions from thermal power producers such as gas power plants and coal power plants increase rapidly69 if they have to operate with low / no load while waiting for them to be needed when the wind blows. In other words, it is not the amount of renewable energy that matters, but the amount of synchronous energy sources70.
Unfortunately, it seems that political leaders around Europe do not understand this, nor do their advisers. Managing a power supply is a balancing act at the moment, and therefore the average figures used for Norwegian production of wind power are completely meaningless.
A good example a few months back should be mentioned. January 8 this year, Europe was minutes from a massive blackout, but several in the power industry in Europe are now of the opinion that a massive blackout will occur where several million customers will be affected71. What often does not come up is the cost of blackout. Not only is it losing power, but worse are all machines and installations that are sensitive to frequency variations and voltage drops that will be physically damaged. The cost of blackouts in Texas is now estimated at up to $ 45 billion72 (or about $ 400 billion). Due to high demand in cold weather and a number of energy sources that did not work for various reasons, 30% of capacity fell out73. Electricity prices rose to almost NOK 80 / kWh74, people died and the damage afterward is enormous. With 20% of Norwegian households completely dependent on electricity for absolutely everything, one can quickly begin to see a catastrophe if something similar should happen in either the Norwegian power supply or in the European power supply on which we depend. In a thorough study of 250 prominent blackouts in the period 1965-2012, the researchers conclude that blackouts occur more often and last longer, especially after 200575, and they, therefore, become a larger and larger share of the risk and cost picture.
When we look at these two factors together, it is clear that the need for investment in renewable energy in the future is great just to keep the supply risk within acceptable limits (then the investment costs in the power sources themselves come at the top). For Germany alone, they have estimated that continuing on the current course will cost another 20,000 – 35,000 billion kroner in the future76, and in fact, the German Office of the Auditor General in its latest report has stated bluntly that the entire Energiewende threatens Germany’s economy, industry, and population77.
What it will cost in the Norwegian context depends entirely on three factors. First, how much supply risk will we accept? If we compare with the current supply risk, the long-term consequences are a combination of sharply increased costs and a greater risk of blackouts. One way to reduce this risk is to save energy and improve existing hydropower plants.
Second, how dependent will we be on foreign countries? In 2019, Norway was just in balance, while in 2020 we had a good surplus with the energy balance compared to abroad. Looking at the details, however, there was a lot of import/export hour by hour, day by day. If Norway is to manage without the rest of the world, we will therefore have to invest aggressively in reliable energy sources and carry out energy saving. The Norwegian power supply will then be risky given that we expect large climate variations in the future because it means that dry years and poor hydropower are a real possibility.
With the current lines, where we build cables to the continent and within Scandinavia, we will eventually have the same price level and supply risk as the rest of the continent. Then Norway has lost its great competitive advantage over several decades – cheap electricity – with the consequences it will have for business, employment, and society. The total cost of this is impossible to estimate realistically, but the 20 billion mentioned earlier gives an indication. Of course, this estimate will increase considerably if we enter into greater technical challenges and supply risk. Third, how many symbolic political projects with long-term commitments will we undertake? As of today, there are no realistic options on the table in relation to large-scale, green transition in Norway other than energy saving and renewal of hydropower:
- We do not have electricity for green hydrogen – only the current own production of 225 thousand tonnes will require approximately 10% of all Norwegian electricity production78. Also, the cost level is very high. Carbon
- Capture and Storage (CCS) is another castle in the air unless technology has been developed that is radically better than today’s best technology. In Texas, the last large plant in the USA recently went bankrupt79, and in 2017 the large plant in Mississippi also went bankrupt after first spending NOK 75 billion80.
- Floating offshore wind is a third technology that does work technically, but the economy is poor. It is not without reason that a Japanese experiment with three turbines for about 10 years failed due to lack of profitability81.
Of course, everything is possible if you throw enough money at the idea, but to what use? The fact is that all this ends up as a cost to the inhabitants in one way or another. The political ingenuity is great to avoid showing what the realities are when the realities speak against politics. For example, the eagerness to avoid increasing the renewable income surcharge (EEC) in the electricity bill has meant that in 2020 an additional subsidy of approximately EUR 11 billion was made in Germany82.
Such behavior erodes trust. In Norway, it is relatively difficult to obtain data that can be analyzed by third parties. We know several people who do not dare to say what they think in this case due to the fear of unwanted consequences in relation to their careers. Therefore, the ultimate cost for Norway will be that we move forward without having an open and honest debate based on facts. If you look at the inflamed case on Haramsøya, there is reason to believe that there will be many such cases in the future.
The developer Zephyr claims in its brochure83 that the plant will «… supply approx. 7000 households ». This is wrong. It will most likely never supply 7,000 households. It will probably supply an average of 7,000 households, but Zephyr does not say that in a third of the time it will supply a few hundred or that in another part of the time maybe 10,000. The plant is therefore predicted on the wrong premises.
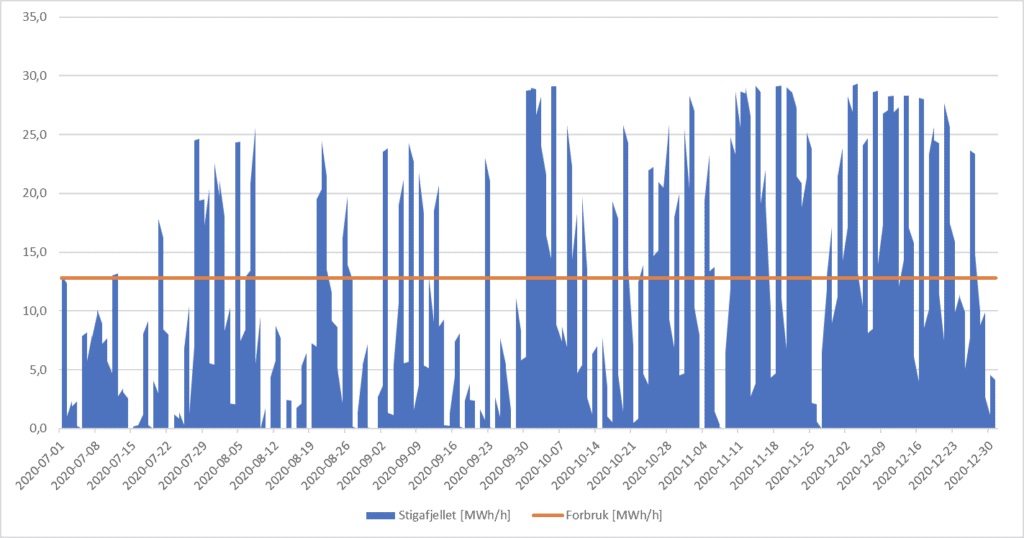
In fact, with its 34 MW power distributed over 8 turbines, the plant is comparable to the Stigafjellet wind power plant, which has 7 wind turbines and 30 MW power, but somewhat poorer wind resources. In Figure 7, we see production from the first of July in 2020 and into the year for Stigafjellet. As a reference, we see the consumption of 4,000 households, which Stigafjellet will supply. The reality is that over a period of 6 months, everyone is without power for 253 hours, someone has to lose power for 1933 hours, while for only 2,230 hours (50% of the time) everyone gets power and there is power left over.
Zephyr will of course be able to say that it is not the intention that these households should only have wind power, but in that case, they could say that this facility will supply the entire European continent. This, of course, everyone had thought was not very credible, although in the extreme consequence it is actually true. Therefore, they serve a credible claim for them to be believed without the important details. The result is that one is left with mistrust, destroyed local communities, mistrust of central authorities, and of course a large financial cost that must be borne by all of us. All this without us doing anything particularly good for the environment. The only ones who profit from this today are the developers, just like in Ontario84 and many other places around the world.
Summary
Norway is one of the most favorable countries for wind power due to hydropower as a possible balancing power, but this presupposes that the wind power plants must purchase capacity from the hydropower plants in order to guarantee production as a proportion of installed capacity. The absence of such agreements, which is the rule today, means that the wind power plants transfer their alternative costs to everyone else. As long as wind power accounts for a smaller share of the total power supply, the economic consequences are limited for the others in the power supply. This situation will be significantly worse if the share of wind power is to be increased significantly, as we are doing today, and which is being planned by many players.
At some point, it is likely that the EU and others will consider the low, real electricity cost in Norway (secured by hydropower) as subsidized because the market is far above. Then the EU and others will be able to argue that it is the value of hydropower you should pay for and not the cost. Then jobs in Norwegian energy-intensive industry will disappear. A situation that will only get worse and worse by investing in unreliable energy sources, such as wind power. At the same time, society is exposed to greater and greater supply risk in step with the downsizing of reliable energy sources in Europe.
Although wind power in Norway can work together with hydropower if you take the measures outlined, you must still be aware of the externalities. Today’s wind power industry destroys natural areas (a cost to tourism and all of us), killing large numbers of birds and insects. It causes large emissions early in its value chain through the production of large quantities of permanent magnets, composites, concrete, and steel. And it leaves behind large amounts of waste in addition to being very space-consuming. All this will be sacrificed for a few jobs85 and an electricity production that varies from 8.3 MWh per hour to 3,275.6 MWh per hour in the peak year 202086. In the study that followed the major power outage in Turkey in 2015, it was pointed out that “A large electric power system is the most complex existing man-made machine” 87. In that case, it is very strange that someone will knowingly expose such a complex system to the great variation that wind power inflicts on the system.
It is difficult to see that politicians in Norway are more informed than they are in Ontario, and it is time that we in Norway begin to learn from all the problems that exist in the countries that have invested heavily in wind power. Then we do not have to repeat these mistakes at great cost to the population and industry. Wind power is expensive (when the alternative costs are included), poor (because it is decoupled from demand) unreliable (depending on the fluctuations of the wind), and has large external costs (which are not calculated in the price). The fact that wind power produces a lot of electricity when it blows a lot is as uninteresting as that something is free when you do not need it.
This means that wind power provides electricity with a low value – so low that it is not commensurate with the destruction and costs either in this country or abroad. If Norway is to reduce climate emissions, this must be done through a technology-neutral policy where all factors are taken into account – the entire “life cycle from cradle to grave”. The simple notion that something is by definition sustainable because it is renewable does not hold. Besides, we must never forget that the cheapest and most environmentally friendly energy is the one we do not use, while the most expensive and destructive energy is the one we thought we had, but which was never delivered!
Notes
- It is a fundamental principle in all good cost management, see Cooper, R. (1990). “Explaining the Logic of ABC.” Management Accounting (UK) (November): pp. 58-60.
- For in-depth discussions with the case, see here; – Emblemsvåg, J. (2020). “On the levelized cost of energy of windfarms.” International Journal of Sustainable Energy 39 (7): pp.700-718. – Emblemsvåg, J. (2021). “On the leveled cost of energy of Solar Photovoltaics.” International Journal of Sustainable Energy 40: https://doi.org/10.1080/14786451.14782020.11867139
- In Germany, the probability of minor power outages has increased as a consequence of renewable energy sources, says Hans-Walter Borries, vice chairman of the critical infrastructure association BSKI, see Knight, B. (2019). Berlin blackout raises questions about Germany’s power grid. DW. https://p.dw.com/p/3EGr4
- Andor, M. A., M. Frondel and C. Vance (2017). «Germany’s Energiewende: A Tale of Increasing Costs and Decreasing Willingness-To-Pay.» IAEE Energy Forum (Fourth Quarter): pp.15-18.
- Dohmen, F., A. Jung, S. Schultz and G. Traufetter (2019). German Failure on the Road to a Renewable Future. Der Spiegel. Hamburg. https://www.spiegel.de/international/germany/german-failure-on-the-road-to-a-renewable-future-a-1266586.html
- https://www.faz.net/aktuell/wirtschaft/klima-energie-und-umwelt/30-39-milliarden-euro-oekostromfoerderung-erreicht-rekord-17141915.html
- Dohmen, F., A. Jung, S. Schultz and G. Traufetter (2019). German Failure on the Road to a Renewable Future. Der Spiegel. Hamburg. https://www.spiegel.de/international/germany/german-failure-on-the-road-to-a-renewable-future-a-1266586.html
- Wetzel, D. (2019). Offshore-Wind treibt Strompreise nach oben (in German) (Offshore wind is driving up electricity prices). Die Welt. Berlin.
- Bundesrechnungshof (2021), Bericht nach § 99 BHO zur Umsetzung der Energiewende im Hinblick auf die Versorgungssicherheit und Bezahlbarkeit bei Elektrizität (Report according to § 99 BHO on the implementation of the energy transition with regard to security of supply and affordability of electricity), Bundesrechnungshof: Bonn.
- Dohmen, F., A. Jung, S. Schultz and G. Traufetter (2019). German Failure on the Road to a Renewable Future. Der Spiegel. Hamburg: https://www.spiegel.de/international/germany/german-failure-on-the-road-to-a-renewable-future-a-1266586.html
- Smil, V. (2020). «Energiewende, 20 Years Later.» IEEE Spectrum 57(12): pp.22-23.
- Devlin, J., et al. (2017), Gas generation and wind power: A review of unlikely allies in the United Kingdom and Ireland. Renewable and Sustainable Energy Reviews 70: p. 757–768.
- Zaboji, N. (2021). Ökostromförderung erreicht Rekord (Green electricity subsidies reach record). Frankfurter Allgemeine. Frankfurt: https://www.faz.net/aktuell/wirtschaft/klima-energie-und-umwelt/30-39-milliarden-euro-oekostromfoerderung-erreicht-rekord-17141915.html
- Which of course is strongly related to Covid-19 and the fall in consumption during the pandemic.
- The situation described in this reference will of course be much worse since wind power causes much more up / down ramping, https://www.geoforskning.no/nyheter/grunnforskning/2492-30-ar-med-rovdrift
- Shaner, M. R., S. J. Davis, N. S. Lewis and K. Caldeira (2018). «Geophysical constraints on the reliability of solar and wind power in the United States.» Energy & Environmental Science 11: pp.914-925.
- Shaner, M. R., S. J. Davis, N. S. Lewis and K. Caldeira (2018). «Geophysical constraints on the reliability of solar and wind power in the United States.» Energy & Environmental Science 11: pp.914-925.
- Emblemsvåg, J. (2020). “On the levelized cost of energy of windfarms”. Int. Journal of Sustainable Energy. doi.org/10.1080/14786451.2020.1753742.
- Jansen, M., et al. (2020), Offshore wind competitiveness in mature markets without subsidy. Nature Energy. 5: pp. 614–622.
- Hughes, G. (2020), Wind Power Economics Rhetoric & Reality – Volume I; Wind Power Costs in the United Kingdom, Renewable Energy Foundation: Salisbury, og 2) Hughes, G. (2020), Wind Power Economics Rhetoric & Reality – Volume II; The Performance of Wind Power in Denmark, Renewable Energy Foundation: Salisbury.
- Aldersey-Williams, J., I.D. Broadbent, and P.A. Strachan (2019), Better estimates of LCOE from audited accounts – A new methodology with examples from United Kingdom offshore wind and CCGT. Energy Policy. 128: p. 25-35.
- The case concerns the use of Levelized Cost of Energy (LCOE) where the industry takes a narrow, business economics angle and smoothly ignores that others incur costs because of them. Therefore, several have spoken out to start looking at the whole system and therefore the term Systems LCOE has been introduced by i.a. Ueckerdt, F., et al. (2013), System LCOE: What are the costs of variable renewables? Energy. 63: pp. 61-75.
- Buvik, M., J. Hole, H. Horne, A.M. Østenby, V. Koestler, O.K. Isachsen and T.B. Ericson (2019). Kostnader for kraftproduksjon 2018.Teknologianalyser 2019. Oslo, Norges Vassdrags- og Energidirektorat (NVE). http://publikasjoner.nve.no/faktaark/2019/faktaark2019_2007.pdf
- First used in 2014 av Borggrefe, F., T. Pregger, H.C. Gils, K.-K. Cao, M. Deissenroth, S. Bothor, M. Blesl, U. Fahl, M. Steurer and M. Wiesmeth (2014). Kurzstudie zur Kapazitätsentwicklung in Süddeutschland bis 2025 unter Berücksichtigung der Situation in Deutschland und den europäischen Nachbarstaaten. Stuttgart,Deutsches Zentrum für Luft- und Raumfahrt (DLR), Institut für Technische Thermodynamik, Abt. Systemanalyse und Technikbewertung and Institut für Energiewirtschaft und Rationelle Energieanwendung (IER), Universität Stuttgart.
- According to NVE (2014). Heating in homes: Mapping of heating equipment and efficiency measures in households. NVE Report 85/2014. Oslo, Norwegian Water Resources and Energy Directorate (NVE). English; Norwegian Water Resources and Energy Directorate. https://publikasjoner.nve.no/rapport/2014/rapport2014_2085.pdf
- Eckert, V. (2019). Does renewables pioneer Germany risk running out of power? Reuters. Frankfurt.
- EPA (2016). Guidance on Data Quality Assessment for Life Cycle Inventory Data. Washington, DC, U.S. Environmental Protection Agency, Combined Heat and Power Partnership.
- Pehl, M., A. Arvesen, F. Humpenöder, A. Popp, E. G. Hertwich and G. Luderer (2017). «Understanding future emissions from low-carbon power systems by integration of life-cycle assessment and integrated energy modelling.» Nature Energy 2(December): pp.939-945.
- Quote from Pearce, F. (2009). How a wind farm could emit more carbon than a coal power station. The Guardian. London.
- 1) Arshi, P. S., E. Vahidi and F. Zhao (2018). «Behind the Scenes of Clean Energy: The Environmental Footprint of Rare Earth Products.» ACS Sustainable Chemistry & Engineering 6(3): pp.3311–3320, og 2) Marx, J., A. Schreiber, P. Zapp and F. Walachowicz (2018). «Comparative Life Cycle Assessment of NdFeB Permanent Magnet Production from Different Rare Earth Deposits.» ACS Sustainable Chemistry & Engineering 6(5): pp.5858-5867.
- Qoute by Dodd, J. (2018). Rethinking the use of rare-earth elements. Windpower Monthly. London, Haymarket Media Group Ltd: https://www.windpowermonthly.com/article/1519221/rethinking-use-rare-earth-elements
- Read the entertaining and well-documented book by Paul Midler (2011); “Poorly Made in China: An Insider’s Account of the China Production Game”. Hoboken, NJ, John Wiley & Sons.
- Hurst, C. (2010). China’s Rare Earth Elements Industry: What Can the West Learn? Fort Leavenworth, KS, U.S. Army Foreign Military Studies Office.
- Alves Dias, P., S. Bobba, S. Carrara and B. Plazzotta (2020). The Role of Rare Earth Elements in Wind Energy and Electricity Mobility: An analysis of future supply/demand balances. JRC Science for Policy Report. Luxembourg, Publications Office of the European Union.
- Rabe, W., G. Kostka and K. Smith Stegen (2017). «China’s supply of critical raw materials: Risks for Europe’s solar and wind industries?» Energy Policy 101: pp.692–699.
- According to Coey, J. M. D. (2020). «Perspective and prospects for rare earth permanent magnets.» Engineering 6(2): pp.119-131.
- Alves Dias, P., S. Bobba, S. Carrara and B. Plazzotta (2020). The Role of Rare Earth Elements in Wind Energy and Electricity Mobility: An analysis of future supply/demand balances. JRC Science for Policy Report. Luxembourg, Publications Office of the European Union.
- According to Imholte, D. D., R. T. Nguyen, A. Iyer, A. Vedanatam, M. L. Brown, B. Smith, C. Anderson, B. O’Kelley and J. W. Collins (2018). An assessment of U.S. rare earth availability for supporting U.S. wind energy growth target. Idaho Falls, ID, U.S. Department of Energy, Idaho National Laboratory.
- Maughan, T. (2015). The dystopian lake filled by the world’s tech lust. BBC Future. London: https://www.bbc.com/future/article/20150402-the-worst-place-on-earth
- According to Alves Dias, P., S. Bobba, S. Carrara and B. Plazzotta (2020). The Role of Rare Earth Elements in Wind Energy and Electricity Mobility: An analysis of future supply/demand balances. JRC Science for Policy Report. Luxembourg, Publications Office of the European Union.
- Seamann, J. (2019). Rare Earths and China: A Review of Changing Criticality in the New Economy. Paris, French Institute of International Relations (ifri), Center for Asian Studies.
- UNSCEAR (2016). Sources, Effects and Risks of Ionizing Radiation, UNSCEAR 2016 Report, Report to the General Assembly. New York, United Nations Scientific Committee on the Effects of Atomic Radiation (UNSCEAR).
- Sonter, L. J., M. C. Dade, J. E. M. Watson and R. K. Valenta (2020). «Renewable energy production will exacerbate mining threats to biodiversity.» Nature Communications 11(4174). https://doi.org/10.1038/s41467-020-17928-5
- Hill, R. W., N. G. Morris, K. A. Bowman and D. Wright (2019). The Isle of Man Seabird Census Report on the census of breeding seabirds in the Isle of Man 2017-18 Isle of Man, Manx BirdLife.
- Trieb, F. (2018). Study Report; Interference of Flying Insects and Wind Parks. Stuttgart, Deutsches Zentrum für Luft- und Raumfahrt (DLR), Institut für Technische Thermodynamik, Systemanalyse und Technikbewertung.
- Sánchez-Bayo, F. and K. A. G. Wyckhuys (2019). «Worldwide decline of the entomofauna: A review of its drivers.» Biological Conservation 232: pp.8-27.
- For a thorough review, see Liu, P. and C. Y. Barlow (2017). «Wind turbine blade waste in 2050.» Waste Management 62: pp.229–240.
- Job, S. (2013). «Recycling glass fibre reinforced composites – history and progress.» Reinforced Plastics 57(5): pp.19-23.
- Liu, P. and C. Y. Barlow (2017). «Wind turbine blade waste in 2050.» Waste Management 62: pp.229–240.
- This figure appears after a review of 19 studies by van Zalk, J. and P. Behrens (2018). “The spatial extent of renewable and non-renewable power generation: A review and meta-analysis of power densities and their application in the U.S.” Energy Policy 123: pp.83-91.
- Read the interesting book by Vaclav Smil; Energy Transitions: History, Requirements, Prospects. Santa Barbara, CA, Praeger.
- Department of Energy i USA legger ut mye god informasjon om energirelaterte spørsmål, se https://www.facebook.com/NuclearEnergyGov/photos/a.202159030360188/858272111415540
- Calculated by the undersigned with data from https://www.statnett.no/for-aktorer-i-kraftbransjen/tall-og-data-fra-kraftsystemet/last-ned-grunndata
- Liebreich, M. (2019). Liebreich: We Need To Talk About Nuclear Power. BloombergNEF: https://about.bnef.com/blog/liebreich-need-talk-nuclear-power
- As you expand, the capacity factor decreases so that you need more and more area for the same production as before, see Caralis G, Rados K, Zervos A. (2010). The effect of spatial dispersion of wind power plants on the curtailment of wind power in the Greek power supply system. Wind Energy 13: 339–55. http://dx.doi.org/10.1002/we.355
- Emblemsvåg, J. (2020). «On the levelized cost of energy of windfarms.» International Journal of Sustainable Energy 39(7): pp.700-718.
- For a good summary, see https://www.ref.org.uk/ref-blog/352-constraint-payments-to-hornsea-offshore-wind
- For a good analysis, see Doherty, R. and M. O’Malley, A New Approach to Quantify Reserve Demand in Systems With Significant Installed Wind Capacity. IEEE Transactions on Power Systems, 2005. 20 (2): pp. 587-595.
- https://www.bloomberg.com/news/articles/2021-01-06/u-k-electricity-grid-creaks-under-repeated-winter-pressure
- Gaffney, F., J.P. Deane, and B.P.O. Gallachoir, Reconciling high renewable electricity ambitions with market economics and system operation: Lessons from Ireland’s power system. Energy Strategy Reviews, 2019. 26: doi.org/10.1016/j.esr.2019.100381.
- EirGrid and SONI, Annual Renewable Energy Constraint and Curtailment Report 2019. 2020, EirGrid: Dublin.
- SEM Committee, DS3 System Services Tariffs and Scalars SEM Committee Decision. 2017, Single Electricity Market (SEM) Committee: Dublin.
- For a detailed study, see NETL, Impact of Load Following on Power Plant Cost and Performance: Literature Review and Industry Interviews. 2012, U.S. Department of Energy, Office of Fossil Energy, National Energy Technology Laboratory (NETL): Washington DC.


40 Comments
Pingback: Goal 7: Affordable and Clean Energy - Bergensia
Pingback: Electricity price shock: The end of Norway as a green power nation - Bergensia
Pingback: LSM99 เว็บตรง
Pingback: คาสิโนออนไลน์เว็บตรง
Pingback: สล็อต ฝากถอน true wallet เว็บตรง 888pg
Pingback: เครื่องสำอางค์เกาหลี
Pingback: result sgp
Pingback: guns for sale
Pingback: dubbele gordijnen
Pingback: pgslot
Pingback: Hunter898
Pingback: Infy
Pingback: 웹툰 사이트
Pingback: ผลบอล
Pingback: พรมปูพื้นรถยนต์ tank 500
Pingback: เกม 3D
Pingback: แทงหวย LSM99
Pingback: นำเข้าสินค้าจากจีน
Pingback: exchange crypto
Pingback: เช่ารถ alphard
Pingback: นำเข้าสินค้าจากจีน
Pingback: คลินิกความงาม อุดมสุข
Pingback: car detailing
Pingback: oxycodone
Pingback: กระเบื้องทางเท้า
Pingback: online chat
Pingback: คาสิโนออนไลน์เว็บตรง ไม่ผ่านเอเย่นต์
Pingback: free cams
Pingback: free tokens
Pingback: จำนำโทรศัพท์
Pingback: lg96
Pingback: แทงหวยออนไลน์ กับ เว็บตรงไม่ผ่านเอเย่นต์
Pingback: เว็บสล็อตที่คนไทยเล่น
Pingback: Timothy
Pingback: เว็บตรงฝากถอนง่าย
Pingback: Lucky Panda
Pingback: pg168
Pingback: winomania
Pingback: เช่ารถเครน
Pingback: vps forex