
To understand how the pandemic is evolving, it’s crucial to know how death rates from COVID-19 are affected by vaccination status.
Our World in Data by Edouard Mathieu and Max Roser November 23, 2021
To understand how the pandemic is evolving, it’s crucial to know how death rates from COVID-19 are affected by vaccination status. The death rate is a key metric that can accurately show us how effective vaccines are against severe forms of the disease. This may change over time when there are changes in the prevalence of COVID-19, and because of factors such as waning immunity, new strains of the virus, and the use of boosters.
On this page, we explain why it is essential to look at death rates by vaccination status rather than the absolute number of deaths among vaccinated and unvaccinated people. We also visualize this mortality data for the United States, England, Switzerland, and Chile.
Why we need to compare the rates of death between vaccinated and unvaccinated
During a pandemic, you might see headlines like “Half of those who died from the virus were vaccinated”.
It would be wrong to draw any conclusions about whether the vaccines are protecting people from the virus based on this headline. The headline is not providing enough information to draw any conclusions.
Let’s think through an example to see this.
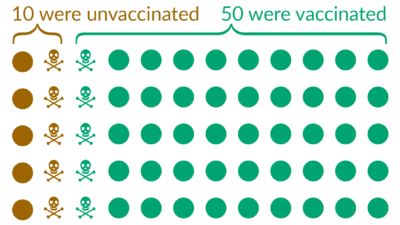
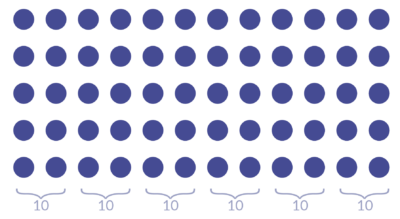
Imagine we live in a place with a population of 60 people.
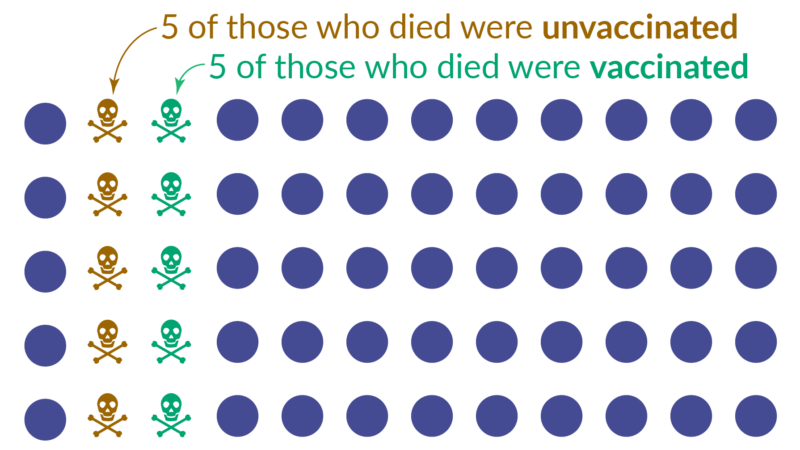
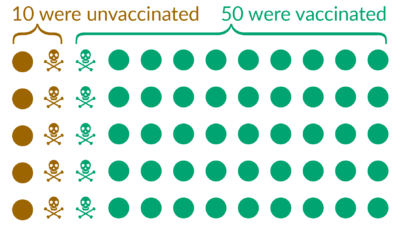
Then we learn that 10 people died. And we learn that 50% of them were vaccinated.
The newspaper may run the headline “Half of those who died from the virus were vaccinated”. But this headline does not tell us anything about whether the vaccine is protecting people or not.
To be able to say anything, we also need to know about those who did not die: how many people in this population were vaccinated? And how many were not vaccinated?
Now we have all the information we need and can calculate the death rates:
- of 10 unvaccinated people, 5 died → the death rate among the unvaccinated is 50%
- of 50 vaccinated people, 5 died → the death rate among the vaccinated is 10%
We, therefore, see that the death rate among the vaccinated is 5-times lower than among the unvaccinated.
In the example, we invented numbers to make it simple to calculate the death rates. But the same logic applies also in the current COVID-19 pandemic. Comparisons of the absolute numbers, as some headlines do, is making a mistake that’s known in statistics as a ‘base rate fallacy: it ignores the fact that one group is much larger than the other. It is important to avoid this mistake, especially now, as in more and more countries the number of people who are vaccinated against COVID-19 is much larger than the number of people who are unvaccinated (see our vaccination data).
This example was illustrating how to think about these statistics in a hypothetical case. Below, you can find the real data for the situation in the COVID-19 pandemic now.
Data on COVID-19 mortality by vaccination status
Here we bring together the official mortality data by vaccination status published by the United States, England, Switzerland, and Chile. These charts are updated weekly if new data has been published by the official source.
United States
The United States has fully vaccinated 62.2% of its population, mostly with the mRNA vaccines produced by Pfizer and Moderna. Mortality data by vaccination status is published by the US CDC. This chart presents the COVID-19 death rate among unvaccinated people and among fully-vaccinated people. You can click the “Change age group” button on the top left to explore data for a specific age group. The mortality rate for the “All ages” group is age-standardized by the US CDC using the 2000 US Census standard population. Rates for specific age groups are calculated as crude incidence rates.
England
England has fully vaccinated 70.9% of its population, mostly with the vaccines produced by AstraZeneca and Pfizer. Mortality data by vaccination status is published by the Office for National Statistics. This chart presents the COVID-19 death rate among unvaccinated people and among fully-vaccinated people. You can click the “Change age group” button on the top left to explore data for a specific age group.
All mortality rates are age-standardized by the ONS per 100,000 person-years, using the 2013 European Standard Population with five-year age groups from those aged 10 years and over. “Person-years” take into account both the number of people and the amount of time spent in each vaccination status.
Switzerland
Switzerland has fully vaccinated 67.4% of its population, mostly with the mRNA vaccines produced by Pfizer and Moderna. Mortality data by vaccination status is published by the Federal Office of Public Health (data coverage also includes Liechtenstein). This chart presents the COVID-19 death rate among unvaccinated people and among fully-vaccinated people. You can click the “Change age group” button on the top left to explore data for a specific age group.
The mortality rate for the “All ages” group is age-standardized by Our World in Data, using single-year age estimates from the 2019 revision of the United Nations World Population Prospects for Switzerland. Rates for specific age groups are calculated as crude incidence rates.
Chile
Chile has fully vaccinated 86.9% of its population, mostly with the Sinovac vaccine. Mortality data by vaccination status is published by the Ministry of Health. This chart presents the COVID-19 death rate among people who are not fully vaccinated, among fully-vaccinated people, and among those who additionally received a booster dose. You can click the “Change age group” button on the top left to explore data for a specific age group.
The mortality rate for the “All ages” group is age-standardized by Our World in Data, using single-year age estimates from the 2019 revision of the United Nations World Population Prospects for Chile. Rates for specific age groups are calculated as crude incidence rates.


34 Comments
Pingback: portal de tecnologia
Pingback: agen slot
Pingback: condo for sale pattaya
Pingback: buy dmt vape pen
Pingback: สล็อตเว็บตรงไม่ผ่านเอเย่นต์
Pingback: togel hari ini
Pingback: Bk8
Pingback: Toy car pallets
Pingback: PRAGMATIC PLAY
Pingback: upx1688.com
Pingback: สล็อตวอเลท
Pingback: bossa jazz
Pingback: เกม 3D
Pingback: navigate to this web-site
Pingback: ราคาบอลวันนี้
Pingback: รับซื้อ iPad
Pingback: scam site: beware do not send money or do business with this site. 100% scam!
Pingback: sunwin
Pingback: EC
Pingback: tiger126
Pingback: ป้ายอัฐิ
Pingback: dark168
Pingback: Koh Tao Scuba Club
Pingback: ตรวจสอบบัญชี ภูเก็ต
Pingback: megac4
Pingback: cat888
Pingback: MLM programs
Pingback: ใบพัดมอเตอร์
Pingback: Betflix168 สล็อตเว็บตรง
Pingback: ufa168
Pingback: pgslot
Pingback: Lsm168th เว็บพนันยอดฮิต มีครบทุกเดิมพัน
Pingback: altogel
Pingback: สล็อตแตกง่าย Happyluke