

As decentralised adoption outpaces centralised statistics, much of the solar revolution is going unrecorded in emerging markets, according to Chinese export data.
China is making record-breaking progress in renewable energy. The country has already achieved its 2030 clean energy goal six years early. With massive investments and policy support, China is set to remain the global leader in renewable energy expansion. China’s cumulative installed solar capacity hit 886.66 GW at the end of 2024, with 277.17 GW of new annual installations, up 45.48% year on year. The deployment surge exceeded forecasts, setting a new historical record for PV installations.
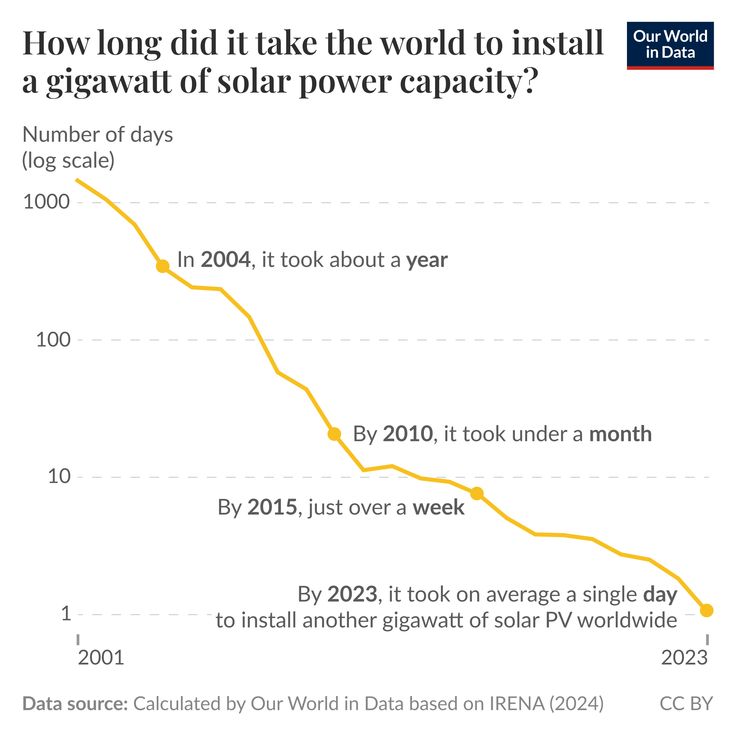
To mitigate the negative impacts of climate change, the world needs to quickly transition from fossil fuels to low-carbon energy sources such as solar power. The chart shows how much this transition has accelerated in the last two decades. In 2004, adding one gigawatt of solar power capacity took about a year. By 2023, the same amount was added, on average, every single day. For reference, a gigawatt of solar is enough to power approximately 200,000 homes in the US.
Much of this growth has been driven by China, which by 2023 accounted for about 43% of the cumulative installed capacity worldwide. A big reason for this acceleration has been a large decrease in the price of solar panels. Since 2001, the price has dropped by about 95%, from $6.21 to $0.31 per watt.
Unless they’re tracking Chinese clean tech export data – which I think only Ember does consistently? – all the energy scenarios models etc are just plain wrong.
— Kate Mackenzie (@katemac.bsky.social) May 10, 2026 at 10:25 AM
Updated May 14, 2026, first published on February 8, 2025.
For the world to transition to low-carbon electricity, energy from these sources must be cheaper than fossil fuels.
Fossil fuels dominate the global power supply because, until very recently, electricity from fossil fuels was far cheaper than electricity from renewables. This has dramatically changed within the last decade. In most places, power from new renewables is now more affordable than new fossil fuels.
The fundamental driver of this change is that renewable energy technologies follow learning curves, which means that with each doubling of the cumulative installed capacity, their price declines by the same fraction. However, the price of electricity from fossil fuel sources does not follow learning curves, so we should expect that the price difference between expensive fossil fuels and cheap renewables will become even more significant.
This is an argument for significant investments into scaling up renewable technologies now. Increasing installed capacity has a significant positive consequence, driving down the price and making renewable energy sources more attractive. In the coming years, most of the additional demand for new electricity will come from low- and middle-income countries; we now have the opportunity to ensure that much of the new power supply will be provided by low-carbon sources.
Falling energy prices also mean that people’s real incomes rise. Investments to scale up energy production with cheap electric power from renewable sources are an opportunity to reduce emissions and achieve more economic growth – particularly for the poorest places in the world.
The world’s energy supply today is neither safe nor sustainable. How can we change this and progress against this twin problem of the status quo?
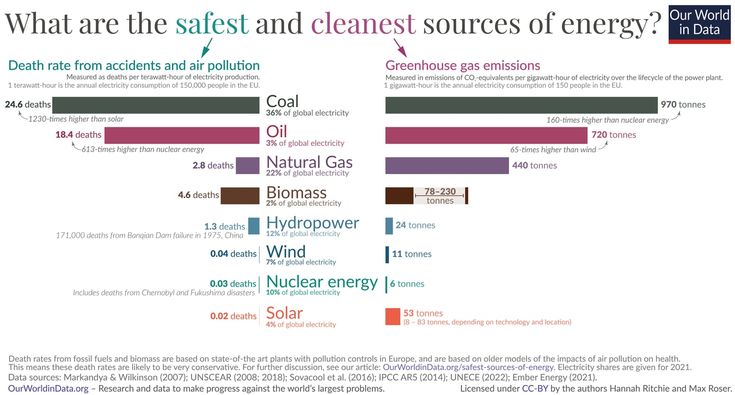
To see the way forward, we have to understand the present. Today, fossil fuels – coal, oil, and gas – account for 79% of the world’s energy production, and as the chart below shows, they have substantial negative side effects. The bars to the left show the number of deaths, and the bars on the right compare the greenhouse gas emissions. My colleague Hannah Ritchie explains the data in this chart in detail in her post, ‘What are the safest energy sources?’.
This makes two things very clear. As the burning of fossil fuels accounts for 87% of the world’s CO2 emissions, a world run on fossil fuels is not sustainable. They endanger the lives and livelihoods of future generations and the biosphere around us. And the very same energy sources lead to the deaths of many people right now – the air pollution from burning fossil fuels kills 3.6 million people in countries around the world every year; this is 6-times the annual death toll of all murders, war deaths, and terrorist attacks combined.1
It is essential to keep in mind that electric energy is only one of several forms of energy that humanity relies on; the transition to low-carbon energy is, therefore, a bigger task than the transition to low-carbon electricity.2
The chart makes clear that the alternatives to fossil fuels – renewable energy sources and nuclear power – are orders of magnitude safer and cleaner than fossil fuels.
Why, then, is the world relying on fossil fuels?
Fossil fuels dominate the world’s energy supply because, in the past, they were cheaper than all other energy sources. If we want the world to be powered by safer and cleaner alternatives, we must ensure that those alternatives are more affordable than fossil fuels.
The price of electricity from the long-standing sources: fossil fuels and nuclear power
Fossil fuels dominate the world’s electricity supply. Coal is the most significant source, supplying 37% of electricity; gas is second and supplies 24%. Burning these fossil fuels for electricity and heat is the largest single source of global greenhouse gases, causing 30% of global emissions.3
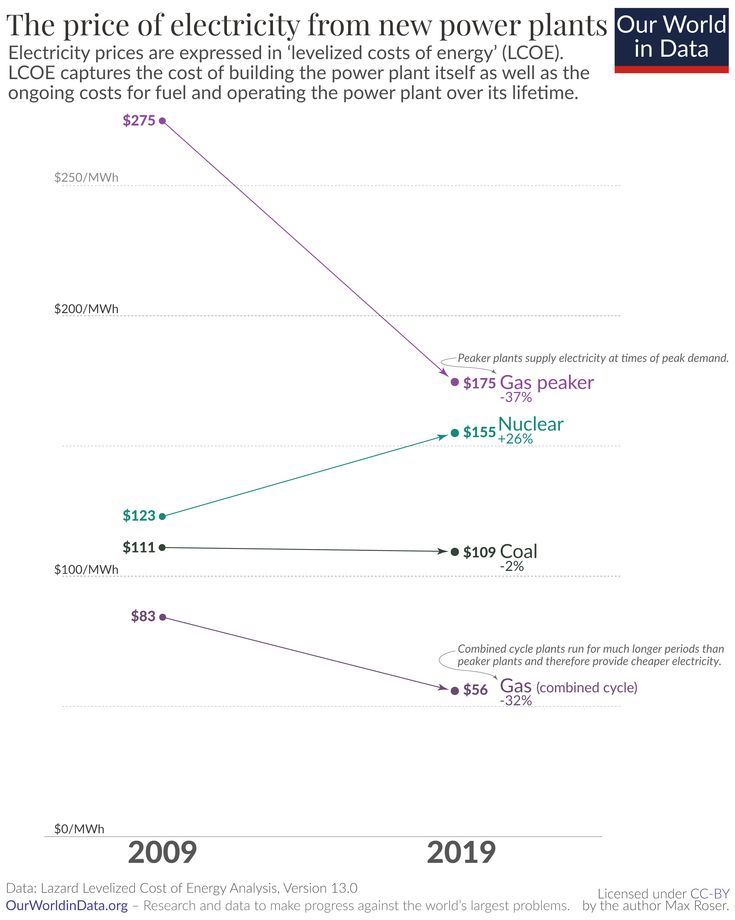
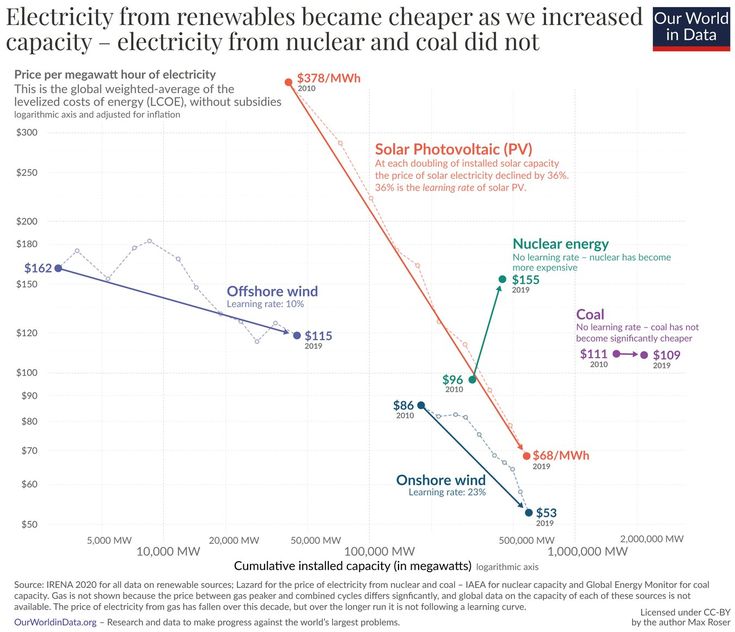
The chart here shows how the electricity prices from the long-standing sources of power – fossil fuels and nuclear – have changed over the last decade. The data is published by Lazard.4
To make comparisons on a consistent basis, energy prices are expressed in ‘levelized costs of energy’ (LCOE). You can think of LCOE from the perspective of someone considering building a power plant. If you are in that situation, then the LCOE answers the following question: What would be the minimum price that my customers would need to pay so that the power plant would break even over its lifetime?
LCOE captures the cost of building the power plant and its ongoing fuel costs over its lifetime. It, however, does not take into account costs and benefits at an energy system level, such as price reductions due to low-carbon generation and higher systemic costs when storage or backup power is needed due to the variable output of renewable sources – we will return to the aspect of storage costs later.5
This makes clear that it is a very crucial metric. If you, as the power plant builder, pick an energy source with an LCOE higher than the price of the alternatives, you will struggle to find someone willing to buy your expensive electricity.
What you see in the chart is that within the last 10 years, the price of nuclear electricity became more expensive, and gas power became less costly. The cost of coal power – the world’s largest source of electricity – stayed almost the same. Later, we will see what is behind these price changes.

The price decline of electricity from renewable sources
If we want to transition to renewables, their price relative to fossil fuels matters.6 This chart here is identical to the previous one, but now also includes the price of electricity from renewable sources.
All of these prices – renewables and fossil fuels – are without subsidies.
Look at the change in solar and wind energy in recent years. Just 10 years ago, it wasn’t even close: it was much cheaper to build a new power plant that burns fossil fuels than to build a new solar photovoltaic (PV) or wind plant. Wind was 22%, and solar was 223% more expensive than coal.
But in the last few years, this has changed entirely.
Electricity from utility-scale solar photovoltaics cost $359 per MWh in 2009. Within just one decade, the price declined by 89%, and the relative price flipped: the electricity you need to charge to break even with the new average coal plant is much higher than what you can offer your customers when you build a wind or solar plant.
It’s hard to overstate what a rare achievement these rapid price changes represent. Imagine if some other good had fallen in price as rapidly as renewable electricity: Imagine you’d found a great place to live back in 2009, and at the time, you thought it’d be worth paying $3590 in rent. If housing had then seen the price decline that we’ve seen for solar it would have meant that by 2019 you’d pay just $400 for the same place.7
I emphasized that it is the relative price that matters in the decision of which type of power plants are built. Did the price decline of renewables matter for the decisions of power plant builders in recent years? Yes, it did. As you can see in our Energy Explorer, wind and solar energy have scaled up rapidly in recent years; in 2019, renewables accounted for 72% of all new capacity additions worldwide.8
Why is this happening? Learning curves and the price of solar photovoltaic modules
How can this be? Why do we see the cost of renewable energy decline so very fast?
The costs of fossil fuels and nuclear power depend primarily on the price of the fuel they burn and the power plant’s operating costs.9 Renewable energy plants are different: their operating costs are comparatively low and they don’t have to pay for any fuel; their fuel doesn’t have to be dug out of the ground, their fuel – the wind and sunlight – comes to them. What determines the cost of renewable power is the cost of the power plant and the cost of the technology itself.
To understand why solar power got so cheap, we have to know why solar technology got cheap. For this, let’s go back in time for a moment.
The first price point for usable solar technology that I can find is from 1956. At that time, the cost of just one watt of solar photovoltaic capacity was $1,865 (adjusted for inflation and 2019 prices).10 One watt isn’t much. Today, one single solar panel of the type homeowners put on their roofs produces around 320 watts of power.11 This means that at the price of 1956, one of today’s solar modules would cost $596,800.12
Solar was hopelessly uncompetitive with fossil fuels at this price – more than half a million dollars for a single panel.
Then why didn’t the history of solar technology end right there?
There are two reasons why, instead of dying, solar has developed to become the world’s cheapest source of electricity today.
Even at a very high price, solar technology was helpful. It is a technology that came from outer space. The first practical use of solar power was to supply electricity for the Vanguard I satellite in 1958. In this high-tech niche, someone was willing to pay for solar technology even at that extremely high price.
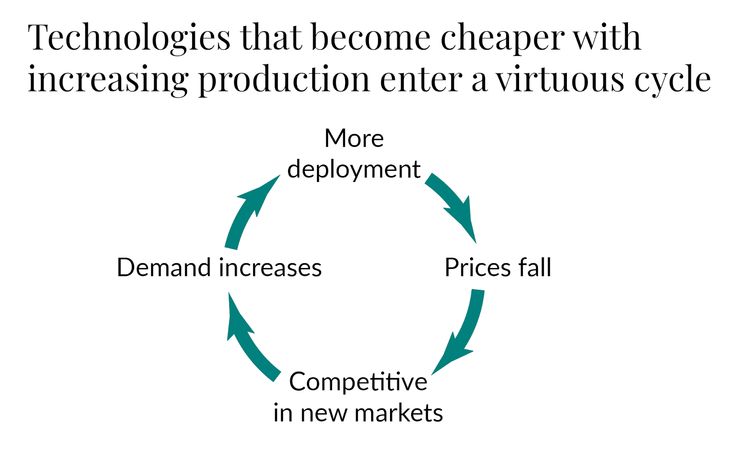
The second important reason is that the price of solar modules declined when more of them were produced. More production allowed us to learn how to improve the production process: a classic case of learning by doing. The initial demand in the high-tech sector meant that some solar technology was produced, and this initial production started a virtuous cycle of increasing demand and falling prices.
The visualization shows this mechanism. To satisfy increasing demand, more solar modules get deployed, which leads to falling prices; at those lower prices, the technology becomes cost-effective in new applications, which in turn means that demand increases. Solar technology has powered itself forward in this positive feedback loop ever since its early days in outer space.
A Short History of Solar: From outer space to the Cheapest Source of energy on earth
During the 1960s, the main application of solar energy remained in satellites. However, the virtuous cycle was set in motion, which meant that the price of solar modules declined slowly but steadily.
With falling prices, technology has come down from space to our planet. The first terrestrial applications in the 1970s were in remote locations where the connection to the wider electrical grid is costly – lighthouses, remote railroad crossings, or the refrigeration of vaccines.13
The data point for 1976 in the top left corner of the chart shows the state of solar technology at the time.
Back then, the price of a solar module, adjusted for inflation, was US-$106 per watt. As you can see on the bottom axis, the global installed solar PV capacity was only 0.3 megawatts. Relative to 1956 this was already a price decline of 94%, but relative to the world’s energy demand solar was still very expensive and therefore very small: a capacity of 0.3 megawatts is enough to provide electricity for about 20 people per year.14
The time series in the chart shows how the price of solar modules has changed from then until now. The so-called ‘learning effect’ in solar technology is incredibly strong: while the installed capacity increased exponentially, the price of solar modules declined exponentially. The fact that both metrics changed exponentially can be nicely seen in this chart because both axes are logarithmic. A measure that declines exponentially on a logarithmic axis follows a straight line.
This straight line that represents the relationship between experience – measured as the cumulative installed capacity of the technology – and the price of that technology is called the learning curve of that technology. The relative price decline associated with each doubling of experience is the learning rate of a technology.
This is the virtuous cycle in action. More deployment means falling prices, which means more deployment. With solar technology, it has been for a long time that its increased deployment has been made possible through government subsidies and mandates. Arguably, the most positive effect of these policies is that they, too, drove down the price of these new technologies along the learning curve. Paying for renewables at a high price point earlier allows everyone to pay less later.
That more production leads to falling prices is not surprising – such ‘economies of scale’ are found in many corners of manufacturing. If you already make one pizza, making a second one isn’t much extra work.
What is truly mind-blowing about solar technology is how strong this effect is: For more than four decades, each doubling of global cumulative capacity was associated with the same relative price decline.
The advances that made this price reduction possible span the entire production process of solar modules:15 larger, more efficient factories are producing the modules; R&D efforts increase; technological advances increase the efficiency of the panels; engineering advances improve the production processes of the silicon ingots and wafers; the mining and processing of the raw materials increases in scale and becomes cheaper; operational experience accumulates; the modules are more durable and live longer; market competition ensures that profits are low; and capital costs for the production decline. Many minor improvements across a sizeable collective process drive this continuous price decline.
The learning rate of solar PV modules is 20.2%.16 With each doubling of the installed cumulative capacity, solar module prices decline by 20.2%.17 The high learning rate meant that the core technology of solar electricity declined rapidly. The price of solar modules declined from $106 to $0.38 per watt—a decline of 99.6%.
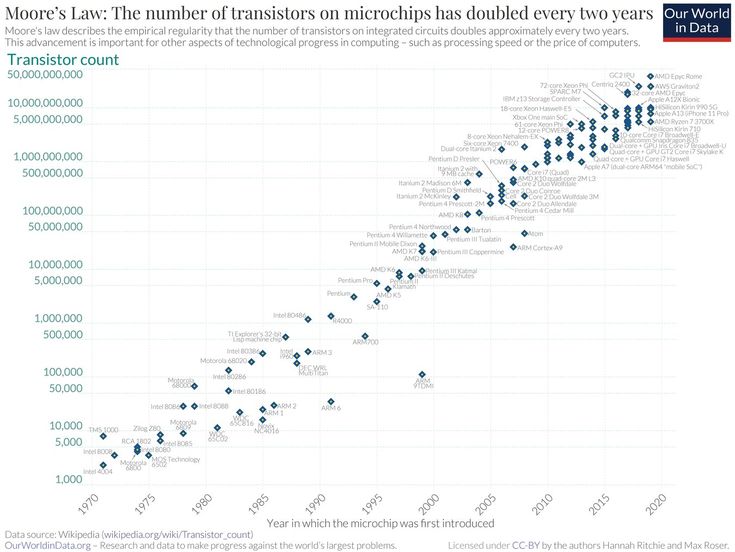
To meet our expectations for the future, we ought to pay a lot of attention to those technologies that follow learning curves. Initially, we might only find them on a high-tech satellite out in space, but the future belongs to them. Renewable energy sources are not the only case; the most well-known case is the computer, and the corresponding historical development is ‘Moore’s Law.’ If you are interested in getting your expectations about the future right, you are interested in how Moore’s Law helps us to see the future of technological development, and you want to know whether it is indeed the case that scaled-up production causes declining prices you can read the following information box that takes a deeper look at it.

How Moore’s Law and Wright’s Law can help us to get our expectations for the future right
Predicting the future: The laws of Gordon Moore and Theodore Paul Wright
Solar modules are not the only technology where we see exponential progress. The case of exponential technological change that everyone knows of is Moore’s law – the observation of Intel’s co-founder Gordon Moore, who noticed that the number of transistors on microprocessors doubled every two years. He first made this observation in 1965, and until today, this extraordinarily fast rate of technological progress still applies.
Integrated circuits are the fundamental technology of computers, and Moore’s law has driven the exponential progress in computers in recent decades – computers have become rapidly cheaper, more energy efficient, and faster.
As you might have noticed, Moore’s law is not stated, as I’ve been looking at solar module prices. Moore’s law describes technological change as a function of time; for solar, I am looking at price changes as a function of experience – measured as the total amount of solar modules ever installed. This relationship that each doubling in experience leads to the same relative price decline was discovered much earlier than Moore’s law by aerospace engineer Theodore Paul Wright in 1936.18. After him, it is called Wright’s Law. Moore’s observation of the progress in computing technology can be seen as a special case of Wright’s Law.19
Solar panels and computer chips are not the only technologies that follow his law. Please have a look at our visualization of the price declines of 66 different technologies and the research referenced in the footnote20
How do we know that increasing experience is causing lower prices? After all, it could be the other way around – production only increases after costs have fallen. In most settings, this is difficult to disentangle empirically, but researchers François Lafond, Diana Greenwald, and Doyne Farmer found an instance where this question can be answered. In their paper ‘Can Stimulating Demand Drive Costs Down?’, they study the price changes at a time when reverse causality can be ruled out when demand was not the consequence of lower prices: the demand for military technology in the Second World War.21 Their finding is that for technologies for which Wright’s Law applies, the cumulative experience determines the price. As demand for weapons grew, production experience increased sharply, and prices declined. When the war ended and demand shrank, the price decline reverted to a slower rate. This suggests that it is the cumulative experience that is driving the price decline that interests us.
Wright’s Law helps us to get our expectations for the future right
If you want to know the future, one of the most valuable questions is which technologies follow Wright’s Law and which do not.
Most technologies do not follow Wright’s Law – the prices of bicycles, fridges, or coal power plants do not decline exponentially as we produce more of them. But those that do follow Wright’s Law – like computers, solar PV, and batteries – are the ones to look out for. They might initially only be found in niche applications, but a few decades later, they are everywhere.
If you are unaware that technology follows Wright’s Law, you can make your predictions very wrong. At the dawn of the computer age in 1943, IBM president Thomas Watson famously said, “I think there is a world market for maybe five computers.”22 At the price point of computers at the time, that was perhaps perfectly true, but he didn’t foresee how rapidly the price of computers would fall. From its initial niche, when there was perhaps truly only demand for five computers, they expanded to more and more applications, and the virtuous cycle meant that the price of computers declined further and further. The exponential progress of computers expanded their use from a tiny niche to the defining technology of our time.
Solar modules are on the same trajectory as we’ve seen before. At the price of solar modules in the 1950s, it would have sounded reasonable to say, “I think there is a world market for maybe five solar modules.” But as a prediction for the future, this statement, too, would have been ridiculously wrong.
To get our expectations about the future right we are well advised to take the exponential change of Wright’s Law seriously. My colleagues Doyne Farmer, François Lafond, Penny Mealy, Rupert Way, Matt Ives, Linus Mattauch, Cameron Hepburn, and others have done important pioneering work in this field. A central paper of their work is Farmer’s and Lafond’s ‘How predictable is technological progress?’ from 2016.23. This research paper focuses on the price of solar modules to avoid repeating Watson’s mistake for solar technology. They detail what I discussed here: how solar modules decline in price, how demand drives this change, and how we can learn about the future by relying on these insights.
To meet our expectations for the future, we ought to pay attention to the technologies that follow Wright’s law. Initially, we might only find them on a high-tech satellite out in space, but the future belongs to them.
Do electricity prices follow learning curves?
Solar PV modules might very well follow a rapidly declining learning curve, but solar modules themselves are not what we want. We want the electricity that they produce. Does the price of solar electricity follow a learning curve?
The visualization shows the relevant data.24 On the vertical axis you see again the LCOE price for electricity and on the horizontal axis you now find the cumulative installed capacity.25 As in the solar module chart, both variables are plotted on logarithmic scales so that the chart line represents the learning rate for these technologies.
In bright orange, you can see the development of the price of solar PV power over the last decade. The learning curve relationship that we saw for the cost of solar modules also holds for the price of electricity. The learning rate is even faster: At each doubling of installed solar capacity, the price of solar electricity declined by 36% – compared to 20% for solar modules.
Wind power – shown in blue – also follows a learning curve. The onshore wind industry achieved a learning rate of 23%. Every doubling of capacity was associated with a price decline of almost a quarter.
Offshore wind had a learning rate of 10% and is still relatively expensive – only 25% cheaper than nuclear and a bit more costly than coal. But for two reasons, experts expect the power from offshore wind to become very cheap in the coming years: larger wind turbine sizes and the fact that the consistent winds out on the sea allow higher load factors.26 The apparent similarity of onshore and offshore wind also means that learning effects in one industry can be transferred to the other.
Fossil fuels and nuclear do not follow learning curves
Electricity generation from renewables is getting rapidly cheaper. What about its competitors? Let’s look first at coal. Why is electricity from coal not getting cheaper?
Coal, the world’s largest source of electricity, is also included in the chart. The global price of electricity from new coal (LCOE) declined from $111 to $109. While solar got 89% cheaper and wind 70%, coal’s electricity price declined by merely 2%.
The stagnating price of coal power in the last decade is not unusual. The historical development of the cost of coal power is nowhere close to what we’ve seen for renewable power. Neither the price of the coal nor the price of the coal plants followed a learning curve. The prices didn’t even decline over the long run.27
Electricity from coal was historically cheap and still is, but it is not getting more affordable. There are two reasons we shouldn’t expect this to change much in the future:
First, there is little room for substantially improving the efficiency of coal power plants. Typical plants have efficiencies of around 33%, while the most efficient ones today reach 47%.28 Even a dramatic, unprecedented improvement from an efficiency of one-third to two-thirds would only correspond to the progress that solar PV modules make every 7.5 years.29
Second, the price of electricity from all fossil fuels is determined by the technology and, to a significant extent, by the cost of the fuel itself. The cost of coal that the power plant burns makes up about 40% of total costs. 30 This means that for all non-renewable power plants with these fuel costs, there is a hard lower bound to how much their electricity cost can decrease. Even if the price of constructing the power plant declines, the price of the fuel means that there is a floor below which the price of electricity cannot pass.
For these reasons, it should not be surprising that coal power does not follow a learning curve.
Electricity from gas: should we expect that the price continues to fall?
Electricity from gas, the second largest fossil fuel source, did become cheaper over the last decade.31 As we saw above, electricity from combined cycle gas plants declined by 32% to a global average cost of $56 per MWh.32
The costs of building a gas plant declined during some periods in the last 70 years, as Rubin et al. (2015) show.33 But the main reason the price of gas electricity declined over the last decade is that the price of gas itself declined over this period. After a peak in 2008, the price of gas declined steeply. The increased supply from fracking is one key reason. However, this decline in the price of gas is not part of a long-run development. The price of gas today is higher than two or three decades ago.
For the same reasons as discussed for coal – limited learning and fuel costs as a floor – we should, therefore, not expect the price of electricity from gas to decline significantly over the coming decades, and we should certainly not expect a learning curve effect similar to what we are seeing for renewables.
Why did nuclear power get more expensive? What can reverse that trend?
For nuclear power, you see the data since 2009 in the chart. Nuclear power has increased in price.
This increase is part of a longer-term trend. In many places building a power plant has become more expensive as the studies reviewed in Rubin et al (2015) document.33 This is, of course, very unfortunate since nuclear is both a low-carbon and one of the safest sources of electricity, as we have seen in the first chart.
One reason for rising prices is the increased regulation of nuclear power, which has the important benefit of increased safety. A second reason is that the world has not built many nuclear power plants in recent years so that supply chains are small, uncompetitive, and are not benefiting from economies of scale.34
These reasons explain why the global average LCOE price has increased. However, for nuclear power, there are significant differences in price trends between countries: Prices and construction times have increased significantly in the US and the UK. At the same time, France and South Korea were at least able to keep prices and construction times constant.35
Michel Berthélemy and Lina Escobar Rangel (2015) explain that those countries that could avoid price surges do not stand out in regulating nuclear power less but in standardizing the construction of reactors more.35 Learning, after all, means transferring the knowledge gathered in one instance to another. No repetition, no learning.
This is in sharp contrast with renewables in particular. While nuclear technology is not standardized and gets built very rarely, solar PV modules and wind plants are the opposite; they are very standardized and often constructed.36
One hope is that a new boom in nuclear power and increased standardization of reactors would lead to declining costs of nuclear power.
But there is no strong price decline anywhere, and certainly nothing that could be characterized by a steep learning curve.
But nuclear could still become more important in the future because it can complement renewables where these energy sources have their weaknesses. First, the intermittency of electricity from renewables remains a challenge, and a viable energy mix in the future post-carbon world will likely include all low-carbon sources, renewables, and nuclear power. Second, the land use of renewables is extensive, and a significant environmental benefit of nuclear power is that it uses very little land.37
Beyond the existing nuclear fission reactors, several teams are working towards nuclear fusion reactors, which could potentially entirely change the world’s energy supply.38
To make nuclear reactors competitive with fossil fuels is again an argument for carbon taxes. Nuclear reactors kill 350 times fewer people per unit of energy than fossil fuel plants, and as a low-carbon technology, they can be key in transitioning away from fossil fuels.
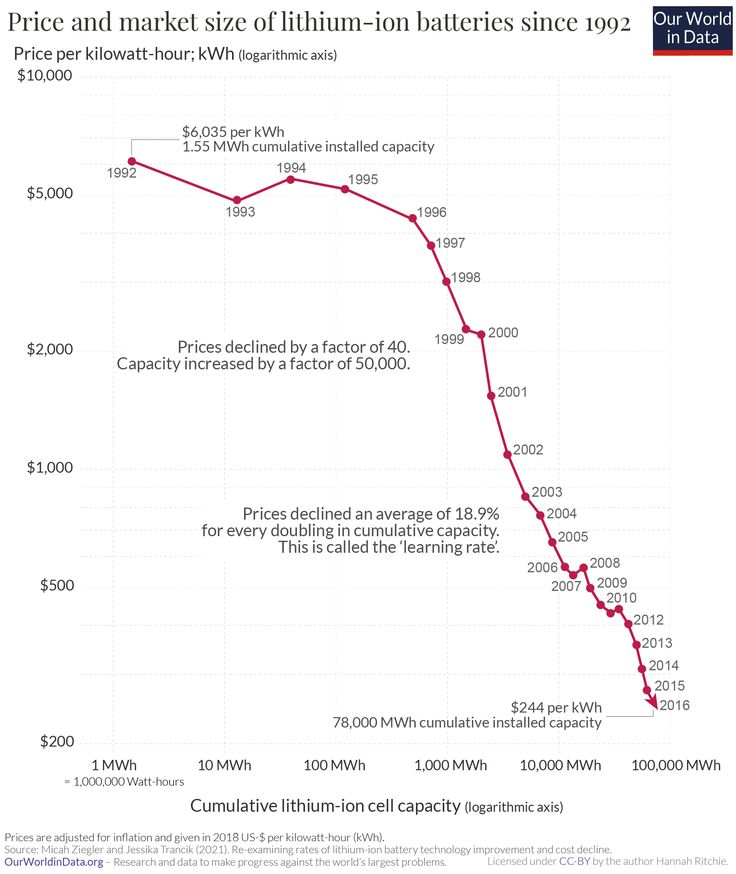
Batteries and electricity storage follow learning curves, too
One of the downsides of renewable sources is their intermittent supply cycle. The sun doesn’t always shine, and the wind doesn’t always blow. Technologies like batteries that store electric power are key to balancing the changing supply from renewables with the inflexible demand for electricity.
Fortunately, electricity storage technologies are among the few that follow learning curves – their learning curve is indeed very steep, as the chart here shows.
This chart is from my colleague Hannah Ritchie; she documents in her article that the price of batteries declined by 97% in the last three decades.39
At their current price, there might only be demand for five large power storage systems in the world, but as a prediction for the future, this might sound foolish one day (if you don’t know what I’m alluding to, you skipped reading the text in the fold-out box above).
Scaling up low-carbon sources leads to lower prices; let’s not waste this opportunity for our planet and economy
The takeaway from the previous discussion is that renewables follow steep learning curves, while fossil fuels do not. A key reason is that renewables do not have fuel costs and comparatively small operating and maintenance costs, which means that the LCOE of renewable energy scales with the cost of their technologies. And the key technologies of renewable energy systems – solar, wind, and batteries – follow a learning curve: each doubling of their installed capacity leads to the same decline in costs.
We have a fantastic opportunity if we are serious about transitioning to a low-carbon global energy system. Scaling up renewable energy systems doesn’t only have the direct benefit of more low-carbon energy but has an indirect side effect that is even more important: cheaper energy.
The learning rates for wind and solar PV are exceptionally fast. It is extremely rare to find technologies of this kind.
Solar and wind have one more big advantage. While there is often little agreement on reducing greenhouse gas emissions, expanding solar and wind power are two hugely popular options with large majorities. Even in the often polarized US, renewables have the support of strong majorities of Democrats and Republicans. 85% of Americans are in favour of expanding wind power and 92% are in favor of expanding solar power, and in other countries the support is often even higher.40
Today, when the global economy and workers worldwide suffer from the COVID-19 recession and when interest rates are low (or even negative), scaling up renewable energy systems offers us a great chance to move forward. It is rare to have a policy option that leads to more jobs, lower prices for consumers, and a greener, safer planet.41
The more renewable energy technologies we deploy, the more their costs will fall. More growth will mean even more growth.
Making renewable energy irresistible: Technological progress somewhere turns into progress everywhere
One last argument on why lower prices due to technological change are so crucial for making the transition to the post-carbon world. If rich countries make investments into renewable technology that drive down the cost along the learning curves, they are not just working towards the transition from fossil fuels to renewable energy for themselves but for the entire world.
The relative price of fossil fuels and renewables is key to deciding which power plant to build. Making low-carbon technology cheap is a policy goal that doesn’t only reduce emissions in your own country but in the entire world forever.
Driving down the price of low-carbon energy should be seen as one of the most important goals (and achievements) of clean energy policy because it matters beyond the borders of the country that is adopting it. This is the beautiful thing about technology: once it is invented somewhere, it can help everywhere.
The most significant growth in electricity demand in the coming years will not come from rich countries but the poorer yet rapidly developing countries in Africa and Asia.42 The steep decline of solar power is an exceptionally fortunate development for many countries with sunny climates.
Energy systems have very long path dependencies since it is very costly to build a power plant or decide to shut it down. Investments in renewable technologies now will, therefore, have very long-term benefits. Every instance when a country or an electricity company chooses to build a low-carbon power plant instead of a coal plant is a win for decades. Low prices are the key argument to convince the world – especially places with the least money – to build low-carbon power systems for a sustainable future.
Conclusion
One of the very worst misconceptions about the challenge of climate change is that it is an easy problem to solve. It is not.
Climate policy is exceedingly difficult43, and the technological challenges are much more significant than the electricity sector alone since it is only one of several significant sectors that must be decarbonized. We need change and technological innovation across all these sectors at a scale that matches the big problem.
But considering changing electricity prices has shown that we have a clear option for making significant progress. Low-carbon technologies that were so expensive just a few decades ago that they were only affordable for satellites have come down steadily in price and now provide the cheapest electricity on the planet (which implies that they are now the cheapest energy source that humanity ever had access to).
Driving down the costs of renewables is key to a green, low-carbon future. Still, it also has a significant benefit for people today: Your real income is the ratio between what you are paid and the price of the goods and services you pay for – that is why falling energy prices means that people’s real income is growing. Falling energy prices mean economic growth and less poverty.
We can hope for a future in which renewables are deployed rapidly, and fossil fuel plants become increasingly unprofitable because renewables follow steep learning curves, and fossil fuels do not. We are heading towards a future in which the disadvantage of fossil fuels will keep increasing.
However, limiting climate change is a race against time, and we have a long way to go. There is a good chance that the world has reached the peak of greenhouse gas emissions last year. It is a huge milestone, but the peak is not the goal; we need to get down to net zero.
The argument for scaling these technologies up sooner rather than later is that we will reach the low-carbon, low-cost future faster. This ensures that the power plants built in the coming years are not fossil fuel plants but renewables.
This is key to bringing down greenhouse gas emissions fast. And it has the side effects that it saves people from air pollution, and reduces energy prices – which means growing incomes and declining poverty.
Acknowledgements
I want to thank Hannah Ritchie, François Lafond, Rupert Way, Marcel Gerber, Ernst van Woerden, Charlie Giattino, and Breck Yunits for reading drafts of this and for their constructive comments and ideas.
Endnotes
- In a study published in the Proceedings of the National Academy of Sciences, Jos Lelieveld et al. (2019) estimated that 5.6 million people died from anthropogenically caused air pollution. Of these 5.6 million, 3.6 million were attributed to fossil fuels.Lelieveld, J., Klingmüller, K., Pozzer, A., Burnett, R. T., Haines, A., & Ramanathan, V. (2019). Effects of fossil fuel and total anthropogenic emission removal on public health and climate. Proceedings of the National Academy of Sciences, 116(15), 7192-7197The death toll of the three counts of violence for 2017 according to the IHME is 561,511.• Homicides: 405,346 deaths• War battles: 129,720 deaths• Terrorism: 26,445 deaths.
- The other two big energy sectors are heat and transport; in the coming years, it is very likely that the share of electric energy will increase because a larger share of transport will be electrified. The IEA reports that electricity’s share in total final energy consumption was 19% in 2018 and expects it to increase to 24% in 2040.
- In 2016 (the latest sectoral breakdown available), global greenhouse gas emissions were 49.36 billion tonnes of CO2eq. Electricity and heat generation was responsible for 15.01 billion tonnes CO2eq. Electricity and heat generation, therefore, accounted for [49.36 / 15.01 * 100 = 30%] of global emissions. This data is sourced from Climate Watch and the World Resources Institute.
- The data source is Lazard’s Levelized Cost of Energy 2019 – the significant advantage of this source is that it includes the cost of electricity from a wide range of sources.
- “Enhanced levelised cost” is an approach that aims to adjust for this, but its measurement is still in its early stages. Simon Evans discusses ‘enhanced levelised costs’ for different electricity sources in the UK.
- This goal – the alternative energy source generating power at a levelized cost of energy (LCOE) equal (or lower) than the currently dominating energy source – is referred to as ‘grid parity’.
- It is tough to find anything else that prices decline just as fast as electricity from renewable sources. The report by IRENA finds that for the 531 individual items that are used to compile the UK’s Consumer Price Index (CPI), only five items have declined more rapidly: strawberries, fruit smoothies, internet computer games, household cleaner and underground/metro fares outside London. But of course, most people spend more money on electricity than on strawberries.IRENA (2020) – Renewable Power Generation Costs in 2019, International Renewable Energy Agency
- IRENA (2020) – Renewable Power Generation Costs in 2019, International Renewable Energy Agency
- In the following section, we will look into their cost structures in detail.
- J. Perlin (1999) – From space to earth: the story of solar electricity. tech publications, Ann Arbor, MI (1999) via Doyne Farmer and Francois Lafond (2016) – How predictable is technological progress? Research Policy. Volume 45, Issue 3, April 2016, Pages 647-665. https://doi.org/10.1016/j.respol.2015.11.001$256 in 1956 adjusted for prices – using the US GDP deflator – equals $1865 in 2019 US-$ according to (https://www.multpl.com/gdp-deflator
- Ben Zientara (2020) – How much electricity does a solar panel produce? Updated version from 4/2/2020
- This is the price per watt multiplied by the output of today’s typical solar panel: 320W * 1865$/W= $596,800.
- The History of Solar. US Department of Energy.
- How much electricity can be generated from 0.3 megawatts of electricity? As a back-of-the-envelope calculation, I used the oldest data for Germany that I could find, which relates to the 1990s, and took an average to average over better and worse years. In the 1990s, Germany had 48.5 MW of solar capacity and generated 23,750 MWh of electricity. This means that in these circumstances and with this technology (surely much better than the technology in 1976), they generated 145,040 kWh per solar PV capacity of 0.3 MW. The electricity demand of a person in Germany is 7,333kWh per year, so 0.3MW could provide electricity for 20 people (145,040kWh/7,333kWh=19.78).
- Kavlak, Goksin and McNerney, James and Trancik, Jessika E. (2017) – Evaluating the Causes of Cost Reduction in Photovoltaic Modules (August 9, 2017). In Energy Policy, 123:700-710, 2018, http://dx.doi.org/10.2139/ssrn.2891516
- As one would expect, the exact learning rate differs slightly across studies, mostly due to differences in the chosen data source, the chosen proxy measure for ‘experience’, the geographic location or the considered time-span.To give the fairest estimate and avoid relying on one unusual data point, I am therefore reporting an average across several experience curve studies for PV that were conducted by de La Tour et al. 2013. The authors found an average learning rate of 20.2% in many studies (see Table 1 of their publication).de La Tour, A., Glachant, M. & Ménière, Y. (2013) – Predicting the costs of photovoltaic solar modules in 2020 using experience curve models. In Energy 62, 341–348. The learning rate implied by the data I’m presenting here is very similar (22.5%).
- Since it is sometimes wrongly claimed, it is not the case that a constant learning rate implies that the cost of technology would eventually need to decline to 0. This misunderstanding does not consider the driving force appropriately. The doubling of the cumulative number of units produced drives the cost decline. Achieving a doubling of that becomes harder and harder as total production increases. Once the cumulative production is already very high, each doubling of cumulative capacity will take longer and longer. Eventually, demand will level off, such that the price decline slows down and stops when the cumulative production of the technology satisfies demand.
- Theodore Paul Wright (1936) – Factors affecting the cost of airplanes. J. Aeronaut. Sci., 3 (4) (1936), pp. 122-128
- Plausibly, it isn’t just the passing of time that drives the progress in computer chips; it is also the learning that comes with continuously expanding the production of these chips. Lafond et al. (2018) explain that the two laws produce the same forecasts when cumulative production grows exponentially, which is the case when production grows exponentially. More precisely, if production grows exponentially with some noise/fluctuations, then cumulative production grows exponentially with very little noise/fluctuations. As a result, the log of cumulative production is a linear trend and therefore predicting cost by the linear trend of time or the linear trend of log cumulative production give the same results. Francois Lafond, Aimee G. Bailey, Jan D. Bakker, Dylan Rebois, Rubina Zadourian, Patrick McSharry, and J. Doyne Farmer (2018) – How well do experience curves predict technological progress? A method for making distributional forecasts In Technological Forecasting and Social Change 128, pp 104-117, 2018. arXiv, Publisher, Data, Code. See also Nagy B, Farmer JD, Bui QM, Trancik JE (2013) Statistical Basis for Predicting Technological Progress. PLoS ONE 8(2): e52669. https://doi.org/10.1371/journal.pone.0052669Wright’s law for solar PV modules has also been given its own name; some call it Swanson’s Law (Wiki).
- Nagy B, Farmer JD, Bui QM, Trancik JE (2013) Statistical Basis for Predicting Technological Progress. PLoS ONE 8(2): e52669. https://doi.org/10.1371/journal.pone.0052669Many more references can be found in Doyne Farmer and Francois Lafond (2016) – How predictable is technological progress? Research Policy. Volume 45, Issue 3, April 2016, Pages 647-665. https://doi.org/10.1016/j.respol.2015.11.001The price of Ford’s Model T followed Wright’s law: each doubling of cumulative production led to the same relative decline in prices. What’s fascinating is that this decline hasn’t stopped until today. An 8hp car, as the Model T, costs what you’d expect: See Sam Korus (2019) – Wright’s Law Predicted 109 Years of Auto Production Costs, and Now Tesla’s
- Lafond, Francois and Greenwald, Diana Seave and Farmer, J. Doyne, Can Stimulating Demand Drive Costs Down? World War II as a Natural Experiment (June 1, 2020). http://dx.doi.org/10.2139/ssrn.3519913
- The first reference to Watson saying this is in an article from Der Spiegel from 26th May 1965 – Sieg der Mikrosekunde
- Doyne Farmer and Francois Lafond (2016) – How predictable is technological progress? Research Policy. Volume 45, Issue 3, April 2016, Pages 647-665. https://doi.org/10.1016/j.respol.2015.11.001See also: de La Tour, A., Glachant, M. & Ménière, Y. (2013) – Predicting the costs of photovoltaic solar modules in 2020 using experience curve models. In Energy 62, 341–348.
- IRENA 2020 for all data on renewable sources; Lazard for the price of electricity from nuclear and coal – IAEA for nuclear capacity and the Global Energy Monitor for coal capacity.
- For fossil fuels and nuclear, we show installed capacity at each point in time (because we are unaware of any data on the cumulative capacity of these energy sources). I am, however, not expecting a large difference between installed and cumulatively built capacity – especially over 10 years and for power sources that have been scaled up mainly before 2009.
- The UK government expects offshore wind to become cheaper than onshore wind by the mid-2030s. Department for Business, Energy & Industrial Strategy (2020) – BEIS electricity generation cost report. Published 24 August 2020. See also the discussion of this report: Simon Evans (2020) – Wind and solar are 30-50% cheaper than thought, admits UK government in Carbon Brief.
- The price of coal plants over time was studied by McNerney et al. (2011), and the authors found that after a decline in construction costs from 1902 until around 1970, the price increased for two decades from 1970 until 1990. They attribute this cost increase to increased restrictions on tolerable pollution (air pollution has fallen rapidly in industrialized countries since 1970). From around 1990 onwards, the price of coal plants remained largely unchanged.J. McNerney, J.D. Farmer, J.E. Trancik (2011) – Historical costs of coal-fired electricity and implications for the future Energy Policy, 39 (6) (2011), pp. 3042-3054 https://doi.org/10.1016/j.enpol.2011.01.037The price of coal itself has fluctuated over the last 150 years, but without a clear long-run trend as the same authors show. Falling transportation costs have made coal cheaper for power plants, but more recently, the price of coal has increased, and overall, the price of coal has not declined over the long run.
- Dawn Santoianni (2015) – Setting the Benchmark: The World’s Most Efficient Coal-Fired Power Plants in Worldcoal
- Doyne Farmer and Francois Lafond (2016) – How predictable is technological progress? Research Policy. Volume 45, Issue 3, April 2016, Pages 647-665. doi.org/10.1016/j.respol.2015.11.001
- J. McNerney, J.D. Farmer, J.E. Trancik (2011) – Historical costs of coal-fired electricity and implications for the future Energy Policy, 39 (6) (2011), pp. 3042-3054 https://doi.org/10.1016/j.enpol.2011.01.037
- There are arguments for and against gas as a source of electricity. Compared with coal, the world’s dominating electricity source, gas is safer and cleaner, as we see in the first chart: the death rate from air pollution and accidents is 9 times lower, and the greenhouse gas emissions are 40% lower per unit of produced energy. A third important consideration is that while power from gas peakers is expensive, they can react quickly and provide electricity at peak times or when the output from other sources, especially renewables, drops. On the other hand it is of course the case that gas is much more deadly and emits much more carbon than nuclear and renewables. Reasonable carbon pricing could strike a balance where the low-carbon alternatives can continue to grow, and gas can take over from coal. At a higher carbon price, gas combined with CCS – carbon capture and storage – can become cost-effective sooner. The UK has implemented a carbon price, and the government expects that from 2025 onwards, the levelised cost for gas-with-CCS will be cheaper than unabated gas. See: Department for Business, Energy & Industrial Strategy (2020) – BEIS electricity generation cost report. Published 24 August 2020. See also the discussion of this report: Simon Evans (2020) – Wind and solar are 30-50% cheaper than thought, admits the UK government in Carbon Brief.
- In the visualization, I am not able to show gas electricity. This is because the price between gas peaker and combined cycles differs significantly, and I am unaware of any global data on the capacity of each of these sources. If you know of data that would allow the addition of gas to the visualization, please contact me. Thank you.
- Edward S.Rubin, Inês M.L.Azevedo, Paulina Jaramillo, Sonia Yeh (2015) – A review of learning rates for electricity supply technologies. In Energy Policy. Volume 86, November 2015, Pages 198-218. https://doi.org/10.1016/j.enpol.2015.06.011
- Michael Fitzpatrick (2017) – Nuclear power is set to get a lot safer (and cheaper) – here’s why https://theconversation.com/nuclear-power-is-set-to-get-a-lot-safer-and-cheaper-heres-why-62207
- See Michel Berthélemy and Lina Escobar Rangel (2015) – Nuclear reactors’ construction costs: The role of lead-time, standardization and technological progress. In Energy Policy Volume 82, July 2015, Pages 118-130. https://doi.org/10.1016/j.enpol.2015.03.015
- A rough back-of-the-envelope calculation by Michael Barnard clarifies this: “There are about 650 gigawatts (GW) of wind energy capacity right now, as one example. The average wind turbine is about 2 megawatts (MW) in capacity globally, as new ones are almost always bigger and often much bigger. That means about 325,000 wind turbines have been built, with almost a million wind turbine blades. Similarly, there are about 584 GW of solar globally. The average solar panel is about 200 Watts in capacity, so that’s about 3 billion solar panels installed already.”
- David J. C. MacKay (2008) – Sustainable Energy – without the hot air. Online at WithoutHotAir.com
- Recent relevant coverage includes Compact Nuclear Fusion Reactor Is ‘Very Likely to Work,’ Studies Suggest (in the New York Times), and somewhat dated but still relevant and fascinating A Star in a Bottle in the New Yorker.
- See also Schmidt, O., Hawkes, A., Gambhir, A. et al. The future cost of electrical energy storage is based on experience rates. Nat Energy 2, 17110 (2017). https://doi.org/10.1038/nenergy.2017.110An updated dataset from 2018 by the authors is available on FigShare hereAnnual updates can be found via Bloomberg NEF, for example here.
- Cary Funk and Meg Hefferon (2019) – U.S. Public Views on Climate and Energy. Pew Research Center.On other countries see Pew Research (2020) – International Science Survey 2019-2020. September 29, 2020 Release
- Two papers on this point: Rupert Way, François Lafond, Fabrizio Lillo, Valentyn Panchenko, J. Doyne Farmer (2019) – Wright meets Markowitz: How standard portfolio theory changes when assets are technologies following experience curves. In Journal of Economic Dynamics and Control. Volume 101, April 2019, Pages 211-238. https://doi.org/10.1016/j.jedc.2018.10.006Farmer, J.D., Hepburn, C., Ives, M.C., Hale, T., Wetzer, T., Mealy, P., Rafaty, R., Srivastav, S. & Way, R. (2019). ‘Sensitive intervention points in the post-carbon transition’. Science, 364(6436), pp. 132-134.
- See the IEA World Energy Outlook 2020 section on electricity.
- Carbon pricing is a policy that would make those who cause emissions pay for them (the wealthiest people in the world who enjoy the best living conditions in human history). Still, most governments fail to implement carbon prices. Where they exist, they are often too low (which has the consequence that the poorest people on the planet are ‘paying’ most for carbon emissions since it is them who are suffering the severest consequences).


Comments are closed.