
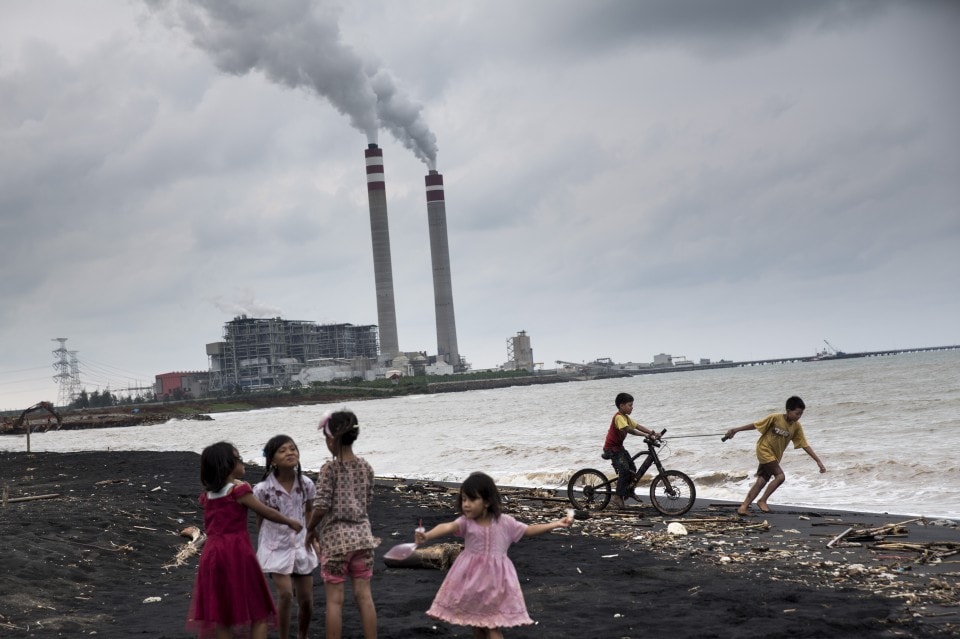
Coal is responsible for over 800,000 premature deaths per year globally and many millions more serious and minor illnesses. In China alone, around 670,000 people die prematurely per year as a result of coal-related air pollution. The ‘Coal Kills’ report estimates that in India coal contributes to between 80,000 to 115,000 premature deaths annually. In the United States coal kills around 13,000 people annually, and 23,300 in Europe. The economic costs of the health impacts from coal combustion in Europe are valued at about US$70 billion per year, with 250,600 life years lost.
The burning of coal emits hazardous air pollutants that can spread for hundreds of kilometers. Pollutants include particulate matter, sulfur dioxide, nitrogen oxides, carbon dioxide, mercury, and arsenic. Exposure to these pollutants can damage people’s cardiovascular, respiratory and nervous systems, increasing the risk of lung cancer, stroke, heart disease, chronic respiratory diseases, and lethal respiratory infections. Children, the elderly, pregnant women, and people with already compromised health suffer most. In addition to pollution originating from power plants, the mining and transport of coal, as well as the disposal of coal ash waste, can have significant impacts on human health.
Over the past few years, pressure from activists, citizens, and public health care professionals has led to seismic shifts in our understanding and regulation of coal. The Chinese government has now banned the construction of new coal plants in the three key economic regions surrounding the cities of Beijing, Shanghai, and Guangzhou after citizens complained about air pollution impacts. European respiratory experts have called air pollution from coal power plants “an ‘invisible killer’ and one of today’s most important public health threats”.
Prologue from endcoal.org
Article by Hannah Ritchie, Our World in Data
At the start of the Industrial Revolution, it was discovered that the energy in fossil fuels can be unlocked to make work more productive. This finding transformed human development: for most of history, living conditions across the world were equally poor. This began to change, rapidly, once we learned how to use coal, oil, and gas. In more recent years, we have also gained access to modern renewables and nuclear power.
The increasing availability of cheap energy has been integral to the progress we’ve seen over the past few centuries. Energy access is one of the fundamental driving forces of development. The United Nations says that “energy is central to nearly every major challenge and opportunity the world faces today.”
But energy production has downsides as well as benefits. There are three main categories:
- Air pollution: An estimated five million people die prematurely every year as a result of air pollution; fossil fuels and biomass burning are responsible for most of those deaths.
- Accidents: As well as deaths caused by the byproducts of energy production, people die in accidents in supply chains, whether in the mining of coal, uranium or rare metals; oil and gas extraction; the transport of raw materials and infrastructure; construction; or their deployment.
- Greenhouse gas emissions: Perhaps the most widely discussed downside is the greenhouse gases emitted by energy production, which are a key driver of climate change.
All energy sources have negative effects. But they differ enormously in the size of those effects. That difference can be easily summed up: by all metrics, fossil fuels are the dirtiest and most dangerous, while nuclear and modern renewable energy sources are vastly safer and cleaner.
From the perspectives of both human health and climate change, it matters less whether we use nuclear power or renewable energy, and more that we change to one or both of them rather than fossil fuels.
Nuclear power is far, far safer than fossil fuels, contrary to public belief
For most of the past 50 years, our energy systems have been dominated by fossil fuels, traditional biomass, hydropower and nuclear energy.1
In the future we expect renewable energy sources to contribute a rising share of total energy, but before we take a closer look at how renewables compare, let’s first see how fossil fuels stack up against nuclear energy in terms of safety.
Anil Markandya and Paul Wilkinson (2007) published an analysis in the medical journal The Lancet, which compared the death rates from the major energy sources.2 In this study, they considered deaths from accidents, such as the Chernobyl nuclear disaster, occupational accidents in mining or power plant operations, and premature deaths from air pollution.3
This study was published in 2007, before the 2011 Fukushima Daiichi nuclear disaster in Japan. You might assume that the figures from this analysis, therefore, understate the death toll from nuclear energy, but in fact, the opposite is true. Later in this article, we look at a more recent study on the safety of low-carbon energy sources, published in 2016 which includes Fukushima impacts, and in fact, reports a lower death rate than Markandya and Wilkinson (2007).4 There were no direct deaths from the Fukushima Daiichi disaster. The official death toll was 573 people, all of which were premature deaths from evacuation and displacement of populations in the surrounding area.5 In 2018, the Japanese government reported that one worker has since died from lung cancer as a result of exposure from the event.
To compare the safety of different energy sources, the researchers compared the number of deaths per unit of energy that is produced by them.6 In the visualization we see the safety comparison of fossil fuels, nuclear and biomass, measured as the number of deaths per terawatt-hour of energy production. One terawatt-hour of energy is about the same as the annual energy consumption of 27,000 citizens in the European Union.7
Nuclear energy is by far the safest energy source in this comparison – it results in more than 442 times fewer deaths than the ‘dirtiest’ forms of coal; 330 times fewer than coal; 250 times less than oil; and 38 times fewer than gas. To be clear: the figures in this analysis were based on energy production in Europe where anti-pollution regulation and technologies are already well ahead of many countries in the world; in this case, the death rate from fossil fuels may even be understated.
Let’s put this into the context of the 27,000 Europeans that one terawatt-hour would provide for. Here we are taking a very simplistic example, but imagine we have a village of 27,000 people.8 If they produced all of their energy from coal, we’d expect 25 people to die prematurely every year as a result (most from the impacts of air pollution). If they generate their energy from oil we’d expect 18 to die every year, and 3 to die if they relied on natural gas.
If they got their energy from nuclear power, in most years there would be no deaths. In fact, it would take at least 14 years before you would expect a single death. It may even be the case that this figure is an overestimate – later in the article we look at a more recent analysis of nuclear safety which suggests this is closer to one death every 100 years.
Fossil fuels have therefore killed many more people than nuclear energy.
In many countries, however, public opinion on nuclear energy is very negative and, as a consequence, policy decisions have in some places turned harshly against it.
In the wake of the 2011 Fukushima nuclear disaster, Germany announced plans to phase out nuclear power generation: over the period from 2011 to 2017 it shut down 10 of its 17 nuclear facilities and plans to close the remaining reactors in 2022.9
These policy decisions can cost lives. In a study published in the journal Environmental Science and Technology, Pushker Kharecha and James Hansen (2013) reversed the conventional question of ‘how many people have died from nuclear power?’ into ‘how many lives has nuclear power saved?’.10 They analysed how many additional people would have died over the period from 1971 to 2009 if nuclear energy had been replaced by fossil fuels. The human cost would have depended on the mix of fossil fuels used to replace nuclear – more would have died if more coal was used than oil or gas – but they estimate an average figure of two million lives saved.11
Replacing nuclear energy with fossil fuels kills people. This is likely to be the case in the recent example of Germany. Most of Germany’s energy deficit from scrapping nuclear was filled by increased coal production – the most polluting source with the largest health impacts. Analysis by Stephen Jarvis, Olivier Deschenes, and Akshaya Jha (2020) estimates that Germany’s nuclear phase-out has come at the cost of more than 1,100 additional deaths each year as a result of air pollution.12 Its plans to make its energy systems safer have done exactly the opposite.
Modern renewables are about as safe as nuclear energy
Renewable energy sources will in the future make up an increasing share of energy supply. How does the safety of renewable energy compare?
Most of us have heard stories of hydropower dams flooding; people falling from roofs when installing solar panels, or wind turbines collapsing. And it’s true, these events happen. But just how common are they? Are the safety concerns about renewable energy exaggerated?
Benjamin Sovacool and colleagues (2016) investigated the safety of low-carbon energy sources in a study published in the Journal of Cleaner Production.13 In this analysis, the authors compiled a database of as many energy accidents as possible over the period from 1950 to 2014 based on an extensive search of academic databases (including ScienceDirect and EBSCO host) and news reports via Google.14
In the visualization, I have combined the two studies described above so we can compare fossil fuels, nuclear and renewable energy. Again, death rates are given per unit of energy to allow a comparison. If you want to compare only low-carbon energy sources, you can find this data here.
You will notice two values for both nuclear and biomass – these represent the slightly different estimates from the two different studies: the earlier work of Markandya and Wilkinson (2007) and a recent analysis by Sovacool et al. (2016). I explain why these figures differ, and also how deaths from nuclear energy are estimated in the dropdown box at the end of this post.
We see a massive difference in death rates from fossil fuels versus nuclear and modern renewable technologies. Nuclear and renewable sources are similarly safe: in the range of 0.005 to 0.07 deaths per TWh. Both nuclear and renewable energy sources have death rates hundreds of times lower than coal and oil and are tens to hundreds of times safer than gas.
This conclusion holds true regardless of whether you choose the higher (conservative) or lower death rate for nuclear energy. It is comparable to renewable energy technologies in both cases.
Let’s again put this into the context of our town of 27,000 EU citizens, who would collectively consume around one terawatt-hour of energy a year. These are the impacts if they got all of their energy from a given source:
- Coal: 25 people would die prematurely every year;
- Oil: 18 people would die prematurely every year;
- Gas: 3 people would die prematurely every year;
- Nuclear: it would take between 14 and 100 years before someone died;
- Wind: 29 years before someone died;
- Hydropower or solar: 42 years before someone died;
- Solar: 53 years before someone died.
As well as being safe, modern renewables and nuclear energy are both extremely low-carbon
So far we’ve only considered the short-term health and social impacts of these energy sources. But we should also take into consideration their potential for future, longer-term impacts in their contribution to climate change.
The good news is that the safest sources are those which are low-carbon.
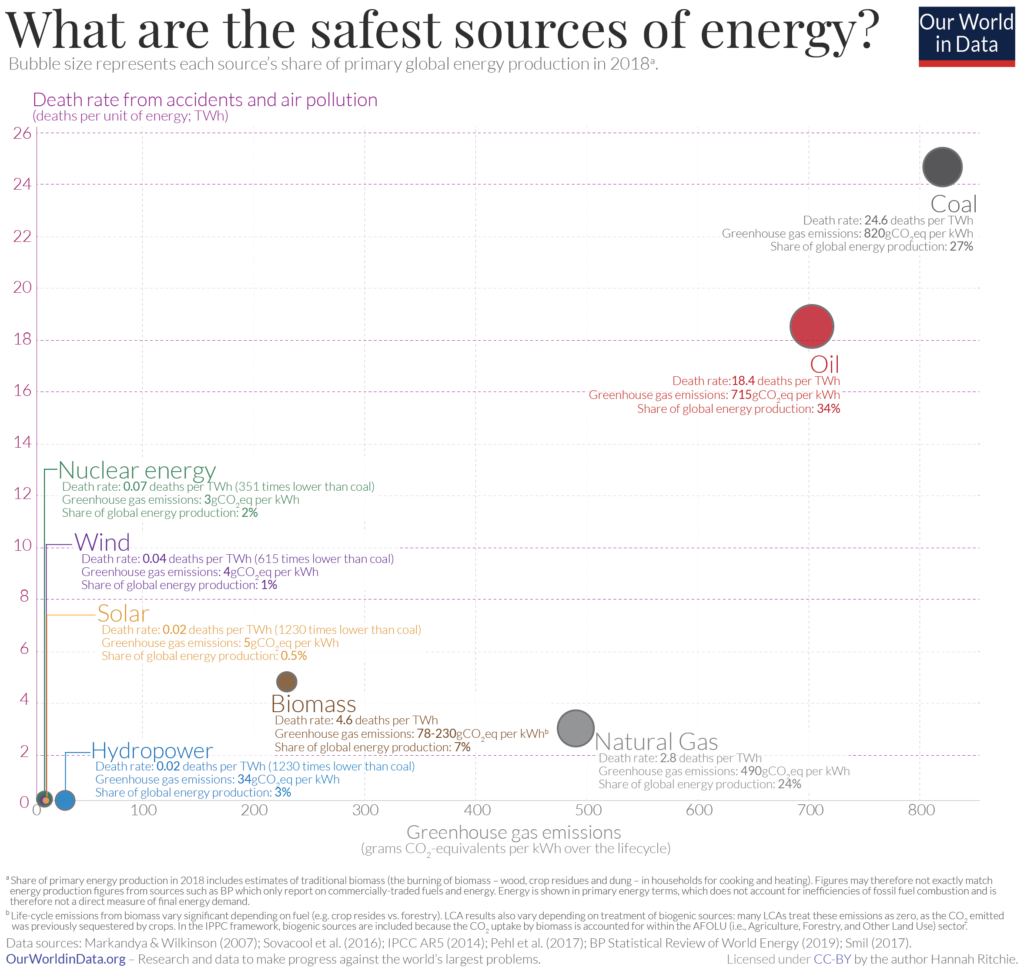
In the visualization I have plotted the death rates per unit energy data we looked at previously (on the y-axis) versus each source’s greenhouse gas emissions per energy unit (on the x-axis).
This measure of greenhouse gas emissions considers the total carbon footprint over the full lifecycle; figures for renewable technologies, for example, take into consideration the footprint of the raw materials, transport, and construction. I have adopted these figures as reported in the IPCC’s 5th Assessment Report (AR5) and more recent life-cycle figures by Pehl et al. (2017) which look at the emissions intensities of technologies in ‘2°C-compatible’ energy transitions to 2050.15,16,17
The size of each bubble represents its share of global primary energy production in 2018 (including traditional biomass in the total).18
There are few trade-offs here – the safer energy sources are also the least polluting. Coal performs poorly on both metrics: it has severe health costs in the form of air pollution and emits large quantities of greenhouse gas emissions per unit of energy. Oil, then gas, is better than coal but is still much worse than nuclear and renewables on both counts.
Nuclear, wind, hydropower and solar energy all cluster in the bottom-left of the chart. They are all safe, low-carbon options. But they still account for a very small share of global energy production – less than 10% of primary energy – as we see from the bubble size.
There is fierce debate about which low-carbon energy technologies we should pursue. And there are of course other aspects to consider, such as cost, construction times, and location-specific resource availability. But on the basis of human health, safety and carbon footprint, nuclear and modern renewables are both winners. A number of studies have found the same: there are large co-benefits for human health and safety in transitioning away from fossil fuels, regardless of whether you replace them with nuclear or renewables.19
Fossil fuels are killing millions of people every year, and endanger many more from the future risks of climate change. We must shift away from them, drawing on all of our available options to do so.
References
- There are numerous conditions under which biomass can be used as an energy source. Here when we refer to ‘traditional biomass’ we mean the burning of solid fuels – wood, crop residues, dung – in households for cooking and heating. This is common in low-to-middle income countries which don’t have access to ‘clean fuels’ for cooking. The use of traditional biomass results in high levels of indoor air pollution, which kills 1.6 million people every year.
‘Traditional biomass’ is distinct from modern biomass, which is the burning of wood and biomass waste in industrial facilities. - Markandya, A., & Wilkinson, P. (2007). Electricity generation and health. The Lancet, 370(9591), 979-990.
- In all cases, pollution-related deaths dominate. In the case of brown coal, coal, oil, and gas, they account for greater than 99% of deaths; 100% of biomass-related deaths; and 70% of nuclear-related deaths (where radiation here is classified under pollution).
- Sovacool, B. K., Andersen, R., Sorensen, S., Sorensen, K., Tienda, V., Vainorius, A., … & Bjørn-Thygesen, F. (2016). Balancing safety with sustainability: assessing the risk of accidents for modern low-carbon energy systems. Journal of Cleaner Production, 112, 3952-3965.
- The Yomiuri Shimbun, 573 deaths ‘related to nuclear crisis’, The Yomiuri Shimbun, 5 February 2012, http://www.yomiuri.co.jp/dy/national/T120204003191.htm.
- Coal, oil, gas, nuclear and biomass produce very different quantities of energy. We cannot simply compare them on this basis: we’d expect that the largest sources of energy would then have the greatest impacts. To do a fair comparison we have to look at the impacts of producing one unit of energy from each of the sources, then compare.
- The average per capita energy consumption in the EU in 2015 was 37,298 kilowatt-hours (kWh). One terawatt-hour (which is equivalent to 1 billion kWh) is therefore the annual energy consumption of [1×10⁹ kWh / 37,298 = 26,811 EU citizens].
- There are of course a range of additional factors which makes this thought experiment simplistic: the number of deaths could depend on factors such as the proximity of residents to the power plant, the age of profile of the population.
- Jarvis, S., Deschenes, O., & Jha, A. (2019). The Private and External Costs of Germany’s Nuclear Phase-Out (No. w26598). National Bureau of Economic Research.
- Kharecha, P. A., & Hansen, J. E. (2013). Prevented mortality and greenhouse gas emissions from historical and projected nuclear power. Environmental Science & Technology, 47(9), 4889-4895.
- van der Merwe, A. (2019). Nuclear energy saves lives. Nature, 570(7759), 36.
- Jarvis, S., Deschenes, O., & Jha, A. (2019). The Private and External Costs of Germany’s Nuclear Phase-Out (No. w26598). National Bureau of Economic Research.
- Sovacool, B. K., Andersen, R., Sorensen, S., Sorensen, K., Tienda, V., Vainorius, A., … & Bjørn-Thygesen, F. (2016). Balancing safety with sustainability: assessing the risk of accidents for modern low-carbon energy systems. Journal of Cleaner Production, 112, 3952-3965.
- The definition of ‘low-carbon’ is sometimes contested: the authors in this study use it to collectively describe eight energy systems: biofuels; biomass; geothermal electricity; hydroelectricity; hydrogen; nuclear power; solar energy (including solar PV as well as solar thermal or Concentrated Solar Power); and wind power (onshore and offshore). They define an accident as: “an unintentional incident or event at an energy facility that led to either one death (or more) or at least $50,000 in property damage,” which is consistent with definitions in the research literature.Sovacool, B. K., Kryman, M., & Laine, E. (2015). Profiling technological failure and disaster in the energy sector: A comparative analysis of historical energy accidents. Energy, 90, 2016-2027.
Since air pollution from low-carbon energy is negligible (traditional biomass is the exception here), most of the deaths from these sources relate to accidents. - Schlömer S., T. Bruckner, L. Fulton, E. Hertwich, A. McKinnon, D. Perczyk, J. Roy, R. Schaeffer, R. Sims, P. Smith, and R. Wiser, 2014: Annex III: Technology-specific cost and performance parameters. In: Climate Change 2014: Mitigation of Climate Change. Contribution of Working Group III to the Fifth Assessment Report of the Intergovernmental Panel on Climate Change [Edenhofer, O., R. Pichs-Madruga, Y. Sokona, E. Farahani, S. Kadner, K. Seyboth, A. Adler, I. Baum, S. Brunner, P. Eickemeier, B. Kriemann, J. Savolainen, S. Schlömer, C. von Stechow, T. Zwickel and J.C. Minx (eds.)]. Cambridge University Press, Cambridge, United Kingdom and New York, NY, USA.
- The IPCC AR5 report was published in 2014 and relies on studies conducted several years prior to its publication. For technologies which have been developing rapidly – namely solar, wind and other renewables, production technologies and intensities have changed significantly since then and will continue to change as energy systems decarbonize. Life-cycle figures for nuclear, solar, wind and hydropower have therefore been adopted by the more recent publication by Pehl et al. (2017), published in Nature Energy.
Pehl, M., Arvesen, A., Humpenöder, F., Popp, A., Hertwich, E. G., & Luderer, G. (2017). Understanding future emissions from low-carbon power systems by integration of life-cycle assessment and integrated energy modelling. Nature Energy, 2(12), 939-945.
The Carbon Brief provides a clear discussion of the significance of these more recent lifecycle analyses in detail here. - Since oil is conventionally not used for electricity production, it is not included in the IPCC’s reported figures per kilowatt-hour. Figures for oil have therefore been taken from Turconi et al. (2013). It reports emissions in kilograms of CO2eq per megawatt-hour. Emissions factors for all other technologies are consistent with results from the IPCC. The range it gives for oil is 530–900: I have here taken the midpoint estimate (715 kgCO2eq/MWh, which is also 715 gCO2eq/kWh).Turconi, R., Boldrin, A., & Astrup, T. (2013). Life cycle assessment (LCA) of electricity generation technologies: Overview, comparability, and limitations. Renewable and Sustainable Energy Reviews, 28, 555-565.
- Energy data here is presented in primary energy terms. This means it does not take into account the inefficiencies in the conversion of fossil fuel energy inputs to final energy consumption. Since we are concerned here with the health impacts and greenhouse gas emissions generated by energy production (i.e. energy inputs) this is a more appropriate comparison than final energy demand – final energy demand would underestimate the air pollution and GHGs generated from fossil fuels. Energy comparisons by primary energy consumption and ‘corrections’ which are a better approximation of final energy demand can be explored here.
- Burgherr, P., & Hirschberg, S. (2014). Comparative risk assessment of severe accidents in the energy sector. Energy Policy, 74, S45-S56.
McCombie, C., & Jefferson, M. (2016). Renewable and nuclear electricity: Comparison of environmental impacts. Energy Policy, 96, 758-769.
Hirschberg, S., Bauer, C., Burgherr, P., Cazzoli, E., Heck, T., Spada, M., & Treyer, K. (2016). Health effects of technologies for power generation: Contributions from normal operation, severe accidents, and terrorist threat. Reliability Engineering & System Safety, 145, 373-387.
Luderer, G., Pehl, M., Arvesen, A., Gibon, T., Bodirsky, B. L., de Boer, H. S., … & Mima, S. (2019). Environmental co-benefits and adverse side-effects of alternative power sector decarbonization strategies. Nature Communications, 10(1), 1-13.
Hertwich, E. G., Gibon, T., Bouman, E. A., Arvesen, A., Suh, S., Heath, G. A., … & Shi, L. (2015). Integrated life-cycle assessment of electricity-supply scenarios confirms the global environmental benefit of low-carbon technologies. Proceedings of the National Academy of Sciences, 112(20), 6277-6282. - The Yomiuri Shimbun, 573 deaths ‘related to nuclear crisis’, The Yomiuri Shimbun, 5 February 2012, http://www.yomiuri.co.jp/dy/national/T120204003191.htm.
- UNSCEAR. Sources and Effects of Ionizing Radiation. Volume II: Effects. Scientific Annexes C, D and E. UNSCEAR 2008 Report. United Nations Scientific Committee on the Effects of Atomic Radiation. United Nations sales publication E.11.IX.3. United Nations, New York, 2011.
- World Health Organization (2016). FAQs: Fukushima Five Years On. Available online at https://www.who.int/ionizing_radiation/a_e/fukushima/faqs-fukushima/en/.
- Reich, M. R., & Goto, A. (2015). Towards long-term responses in Fukushima. The Lancet, 386(9992), 498-500.
- United Nations Scientific Committee on the Effects of Atomic Radiation. (2015). Report of the United Nations Scientific Committee on the effects of atomic radiation to the general assembly.


Comments are closed.