If we are to create a circular economy, we need to change the framework conditions on several fronts at the same time.

Anders Waage Nilsen
Entrepreneurial activist and storyteller.
Original text first published in Norwegian at The Circle
The idea of a regenerative economy without waste is a utopia. In the same way as the classless society. Or the perfect market. Or the zero-emission society. Such utopias are important because they set ideas in motion. They are endstations in various stories about the path to a better society. They can give direction and legitimacy to politics and strategy.
At the same time, they can be dangerous. The distance between the present situation and the utopia is often large. It can create powerlessness and frustration. There is no “revolution” that can instantly change heavy industrial and economic structures. Often the stories become too simple. The road to a more circular society requires systematic work, on many fronts, over a long period of time. Whether you are a state or a company, a form of systematics is required, a structure of counting edges that tells us that we are on the right course.
This system is lacking today. Partly because the circular economy is poorly understood. Partly because circularity is a rather abstract, weakly defined, and systemic concept that is interpreted and understood differently. Lately, I’ve been thinking a lot about these drivers behind the circular economy. What are the underlying goals that point in the direction of circularity, what are the associated goal numbers?
What needs to be changed must be measured. To create politics or strategy for something, we need something that tells us that we are on the right path. We must put labels on the improvements we want to create, identify instruments, and who is responsible. At the same time, in any circular model, there will be many dependencies: for example, it is impossible to build profitable recycling without things being collected. It is impossible to scale collection without there being a demand for secondary raw materials. And so on. It quickly becomes so systemic that one becomes dizzy.
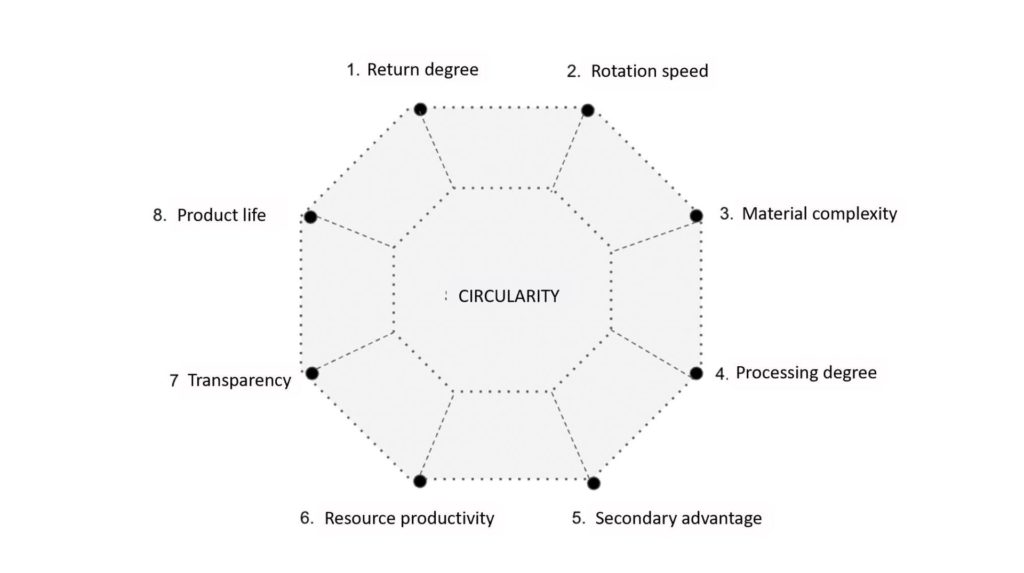
Is it possible to simplify? I tried to make a model where I define some external conditions that indirectly contribute to the phenomenon that is often referred to as circularity. I thought of it all as a kind of algorithm: To increase the circularity, one must create a change for the better in one or more underlying target numbers. Such a framework of well-defined indicators may perhaps lead us in the direction of a circular economy, which I think of as an emergent state. Slightly inspired by the OKR model of Google (“objectives and key results”), I drew up this model;

The numbered points are concrete indicators that 1) can be improved and 2) are measurable. Circularity is at the center of the model, a kind of high-level target figure. I think this is the degree of value creation in society that is based on repurposing, reusing, and recycling resources. That is the part of the economy that is not driven by virgin input factors. Behind each point, there is a definition and a set of underlying sub-goals and target numbers.
1. Return degree
The degree of return is about the proportion of our materials that are returned to the system to be included in existing or potential circular value chains. That is, how much of the materials do not go to landfills or incineration. It is thus about a good system for waste management, with a sorting infrastructure that supports the processes further back in the value chain. The deposit scheme for plastic bottles/and aluminum cans is a good example of a tool that has increased the return rate.
2. Rotation speed
Very many molecules are long unproductive, in landfills, warehouses, and outdoor stalls. Rotation speed is about how efficiently we manage to get them back into production. This is especially important for resources that are in short supply, such as precious metals. Here we can work on creating incentive systems and return programs that make it more profitable to deliver something back than to have it lying around. The cell phone mortgage is a good example.
3. Material complexity
As long as our products are designed in a way that makes them non-recyclable, most will go to lower-grade recycling. Material complexity is about the proportion of material that can be returned to the loop with the same (or better) quality. The goal is thus the lowest possible complexity, the highest possible purity. Plastic packaging composed of several types of plastic or non-recyclable composites increases complexity.
4. Processing degree
This is about how high we manage to lift our material resources in the value pyramid. What you collect can be treated in different ways. Very much of what is called “recycling” in the statistics is in down circulation. There is great potential for reusing the materials at the same level or even increasing the value through refining – upscale-recycling.
5. Secondary advantage
Secondary advantage is a new word, it describes how competitive reused/recycled material is, compared to virgin / new materials. If virgin material is cheaper than recycled material, the secondary advantage is negative. It is not profitable to use such materials, ergo the demand is low. Here we are talking about a combination of regulatory conditions (for example, taxation of virgin material) and reduced costs in the production stage.
6. Resource productivity
Resource productivity in this context is about how much value we create per unit or energy unit. Here both improvement and innovation come into the picture, this is about both product design, the production process, and business models. Can we reduce the amount of materials used? Can we build new service models that allow more consumers to share products? Can we change attitudes among consumers that reduce or eliminate demand altogether?
7. Transparency
Transparency is about our ability to calculate the footprint of a product or service throughout the value chain. So we are talking here about the data basis for life cycle calculations. This target number takes into account that an end product will always be the sum of a bunch of underlying processes. High transparency means that the footprint can be visible to consumers. If you want to strengthen transparency, both documentation requirements and value chain initiatives can be important tools.
8. Product life
Product life says something about how long the manufactured product has value before it has to return to the loop. In many product categories, both electronics, means of transport and construction, it will be important to extend the service life. A commercial building, for example, has an average lifespan of 58 years, if we manage to double the lifespan (either on the building itself or the materials used), we will in practice halve the CO2 footprint. This is where maintenance, repair, and design come into play. A relevant tool could be Right to repair, which was introduced in France in 2020.
Does this model work?
I do not know. This is a thought experiment, which is still in its early stages. I am a practical solution architect, not a social economist. For my part, I personally experience that the map functions as a functional thinking tool to unravel the intricacies of circularity and find points for improvement. But maybe there are some others who have suggestions on how the model can be improved?
Anders


2 Comments
Pingback: Cozy Coffee
Pingback: relaxing bossa nova